“The only thing more unthinkable than leaving was staying; the only thing more impossible than staying was leaving. I didn't want to destroy anything or anybody. I just wanted to slip quietly out the back door, without causing any fuss or consequences, and then not stop running until I reached Greenland.”
Eat, Pray and Love
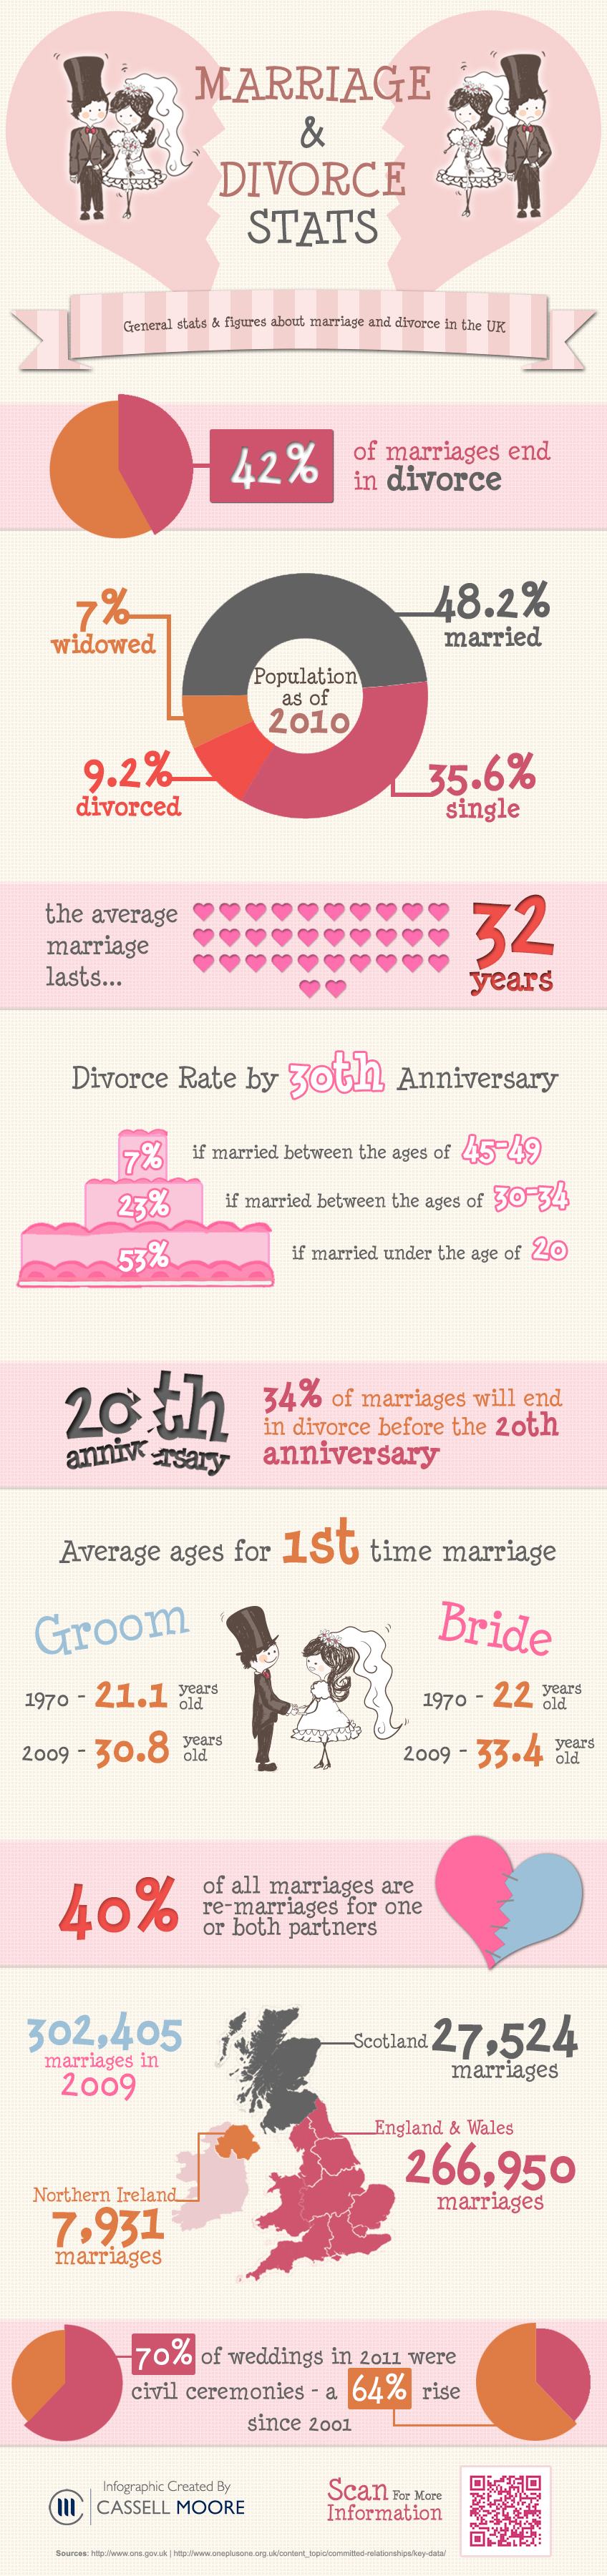
Most of the marriages what has happened out of love and attachment are being torn up and divorced. The main reason behind these divorces is numerous reasons which include both silly and the serious ones.
People who are bound in the marital relation at their early 20’s account the major couples who are getting divorced. Divorce percentage is low in the case of the couples who got married after 45- 95 and moderate in couples who got married after 30-34.