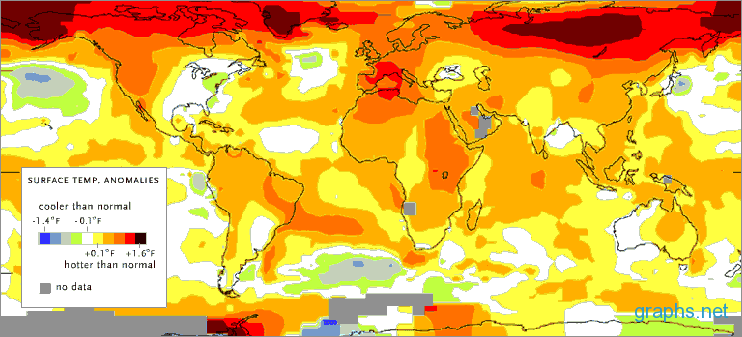
Global warming commonly refers to the rise in the average temperature of Earth's atmosphere and oceans since the late 19th century. Global warming has become the most complicated issue facing world leaders.
Warnings from the scientific community are becoming louder, as an increasing body of science points to rising dangers from the ongoing buildup of human-related greenhouse gases — produced mainly by the burning of fossil fuels and forests.
However, the technological, economic and political issues that have to be resolved before a concerted worldwide effort to reduce emissions can begin have gotten no simpler, particularly in the face of a global economic slowdown.