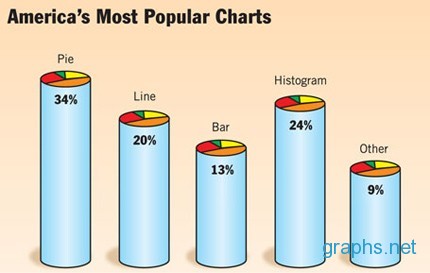
People across the world use different charts for presenting data found in studies and surveys, etc. However, when it comes to the US, 34% of Americans use pie charts while 20% of US utilize line charts to present large information.
Similarly, while 13% of Americans apply bars, 24% of people depend upon histograms to display data. But 9% of people rely on some other graphical representations to show information.
