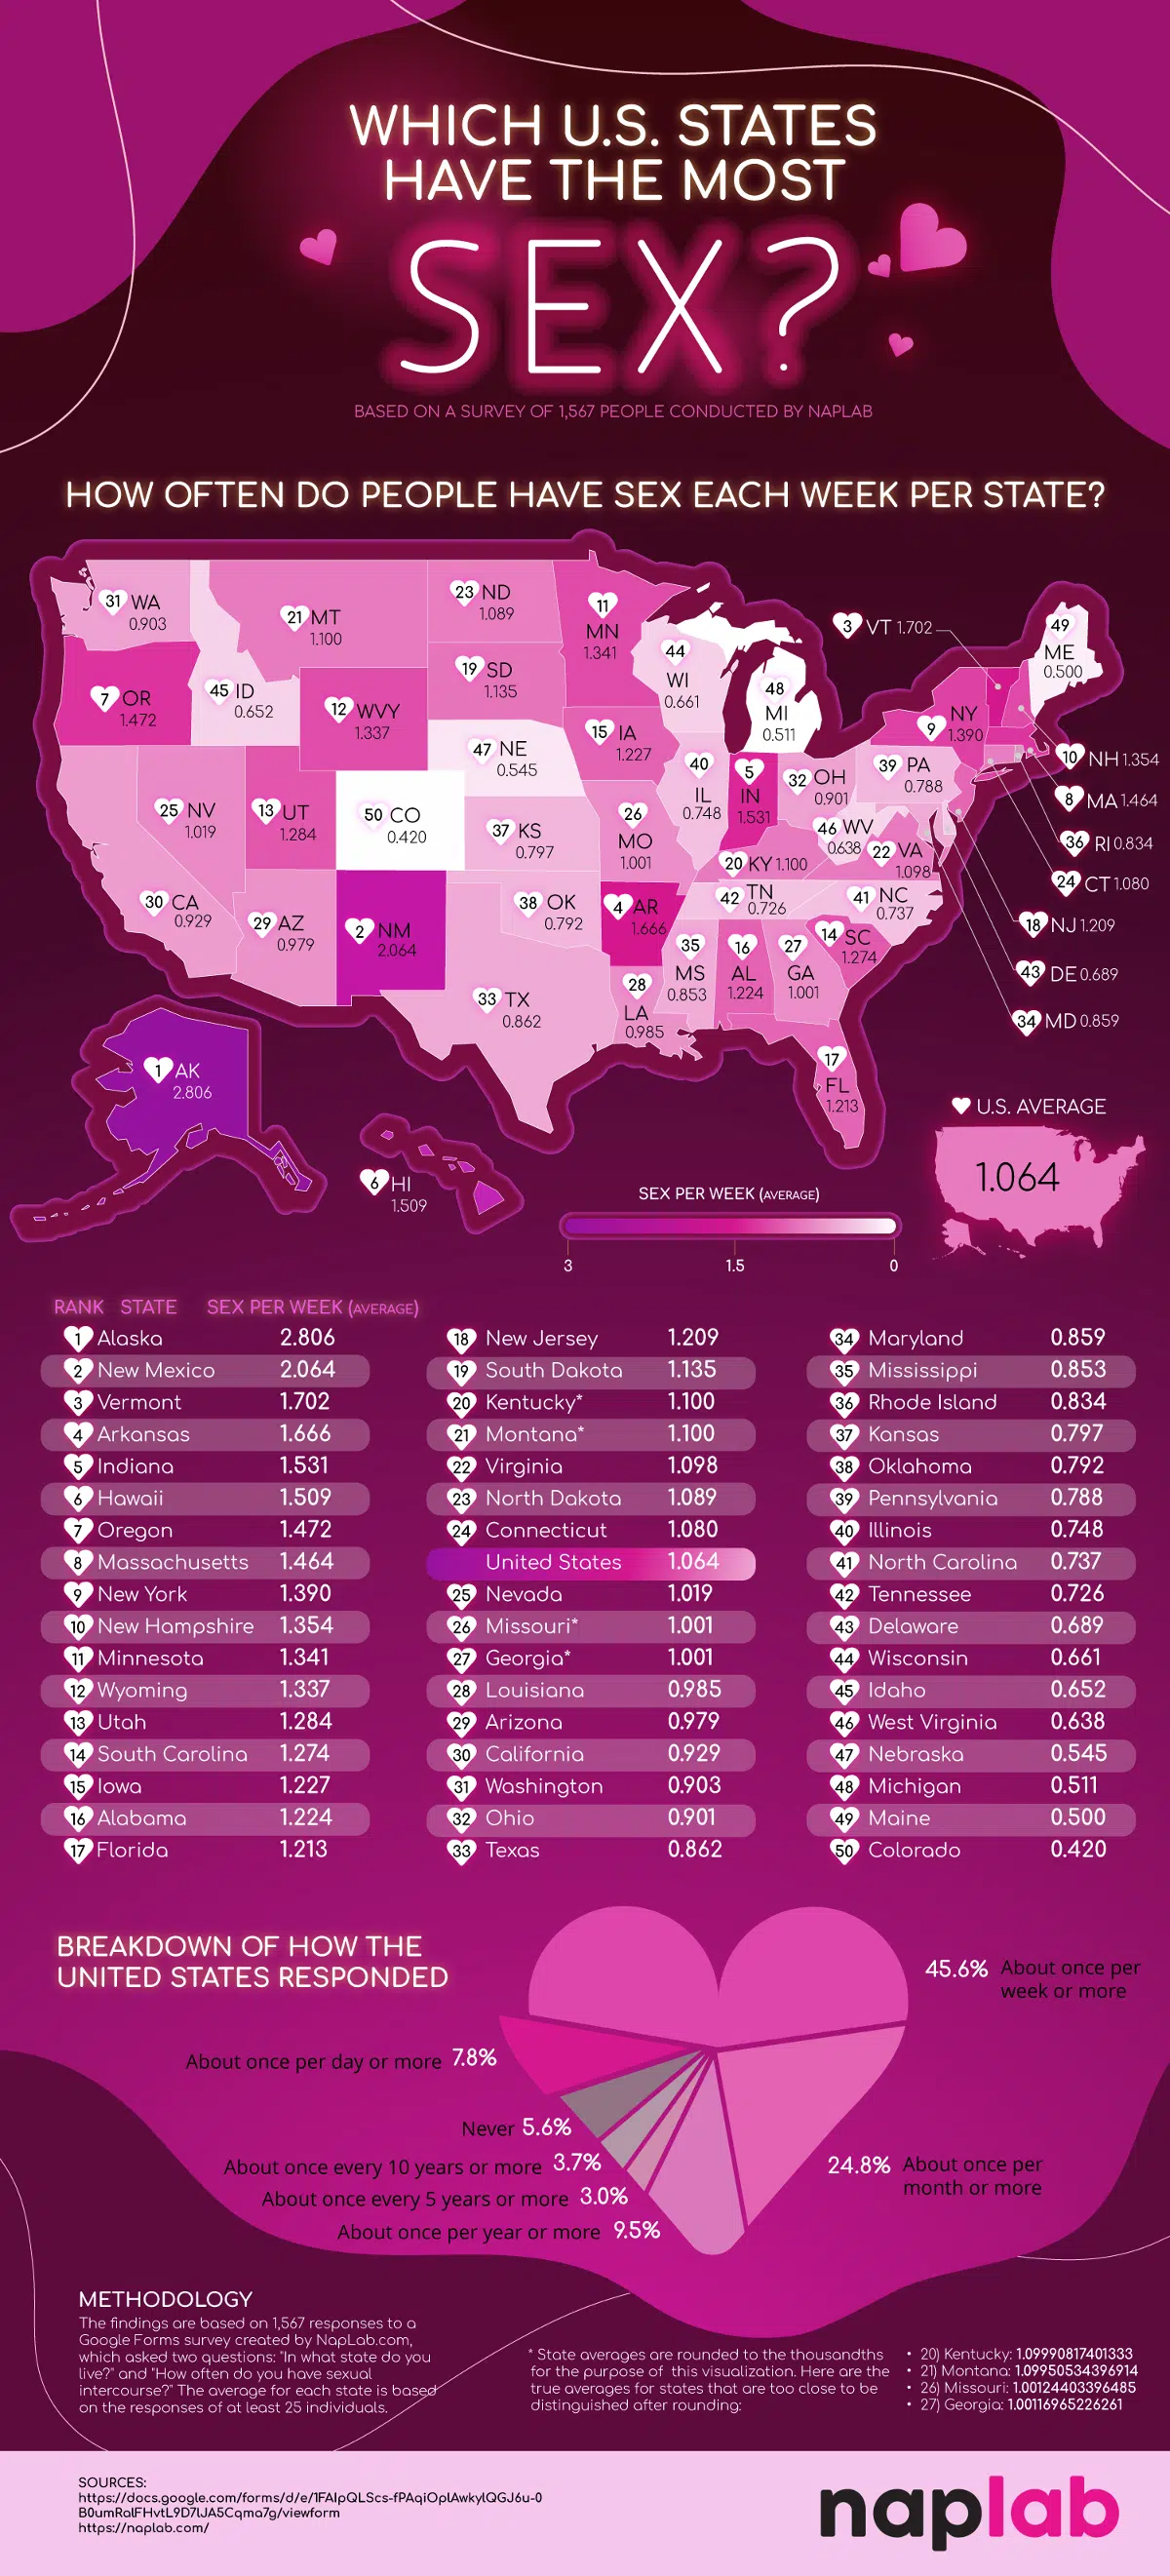
How often are Americans having sex? Studies have revealed that individuals in their 20s engage in sexual intercourse approximately 80 times per year, averaging once every four or five days. Over time, this rate declines, reaching an average of around 20 times per year for individuals in their sixties. To explore this further, NapLab conducted a survey involving 1,567 participants and created an insightful infographic that highlights the U.S. states with the highest and lowest rates of sexual activity. The findings indicate that Alaska boasts the highest average weekly sex frequency at 2.806 times, followed by New Mexico (2.064), Vermont (1.702), Arkansas (1.666), Indiana (1.531), Hawaii (1.509), Oregon (1.472), Massachusetts (1.464), New York (1.390), and New Hampshire (1.354). On the other end of the spectrum, the states with the lowest rates of sexual activity are Colorado (0.420 times per week), Maine (0.500), Michigan (0.511), Nebraska (0.545), West Virginia (0.638), Idaho (0.652), Wisconsin (0.661), Delaware (0.689), Tennessee (0.726), and North Carolina (0.737).