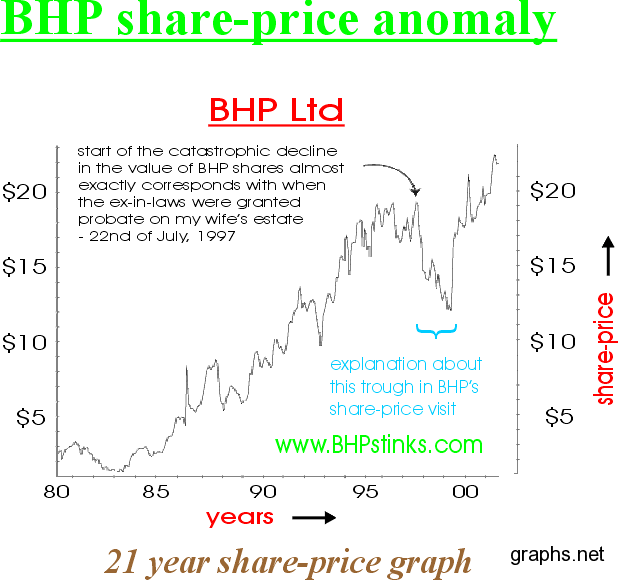
If you’re one of those people who love investing in stocks and are avid addicts of the Bloomberg Channel, then probably you could read share price graphs with your eyes closed. But if you’re like me who flips the channel at the sight of a graph with the word NASDAQ and the likes, then let us discover together what these graphs are and what are it’s relevance to our lives
To start with, a share price is the price of a single share of a company’s stock. This is reached by dividing the market capitalization by the total number of shares outstanding. So when you purchase even a single company stock, you automatically become a shareholder of the company.
In this day and age, with the financial market in turmoil, it is important to consult share price graphs before going into any investment with any company. The fluctuations in a company’s share price are well illustrated in a chart of its daily movements. A lot of financial services companies have these charts. There are also specialist firms which specialize in producing and analyzing share price charts, interpreting the movements to make predictions of future prices.
Before you purchase a stock, you need to check the underlying earnings per share history against the share price chart. The price movements will in most cases be greater than the fluctuations in earnings and this evidence must be taken into account in finalizing the share price forecast.
But then, again, if you’re new to this buying and selling of stocks practice, best consult with a professional instead of just relying on your own interpretation of the graph, just to be sure.