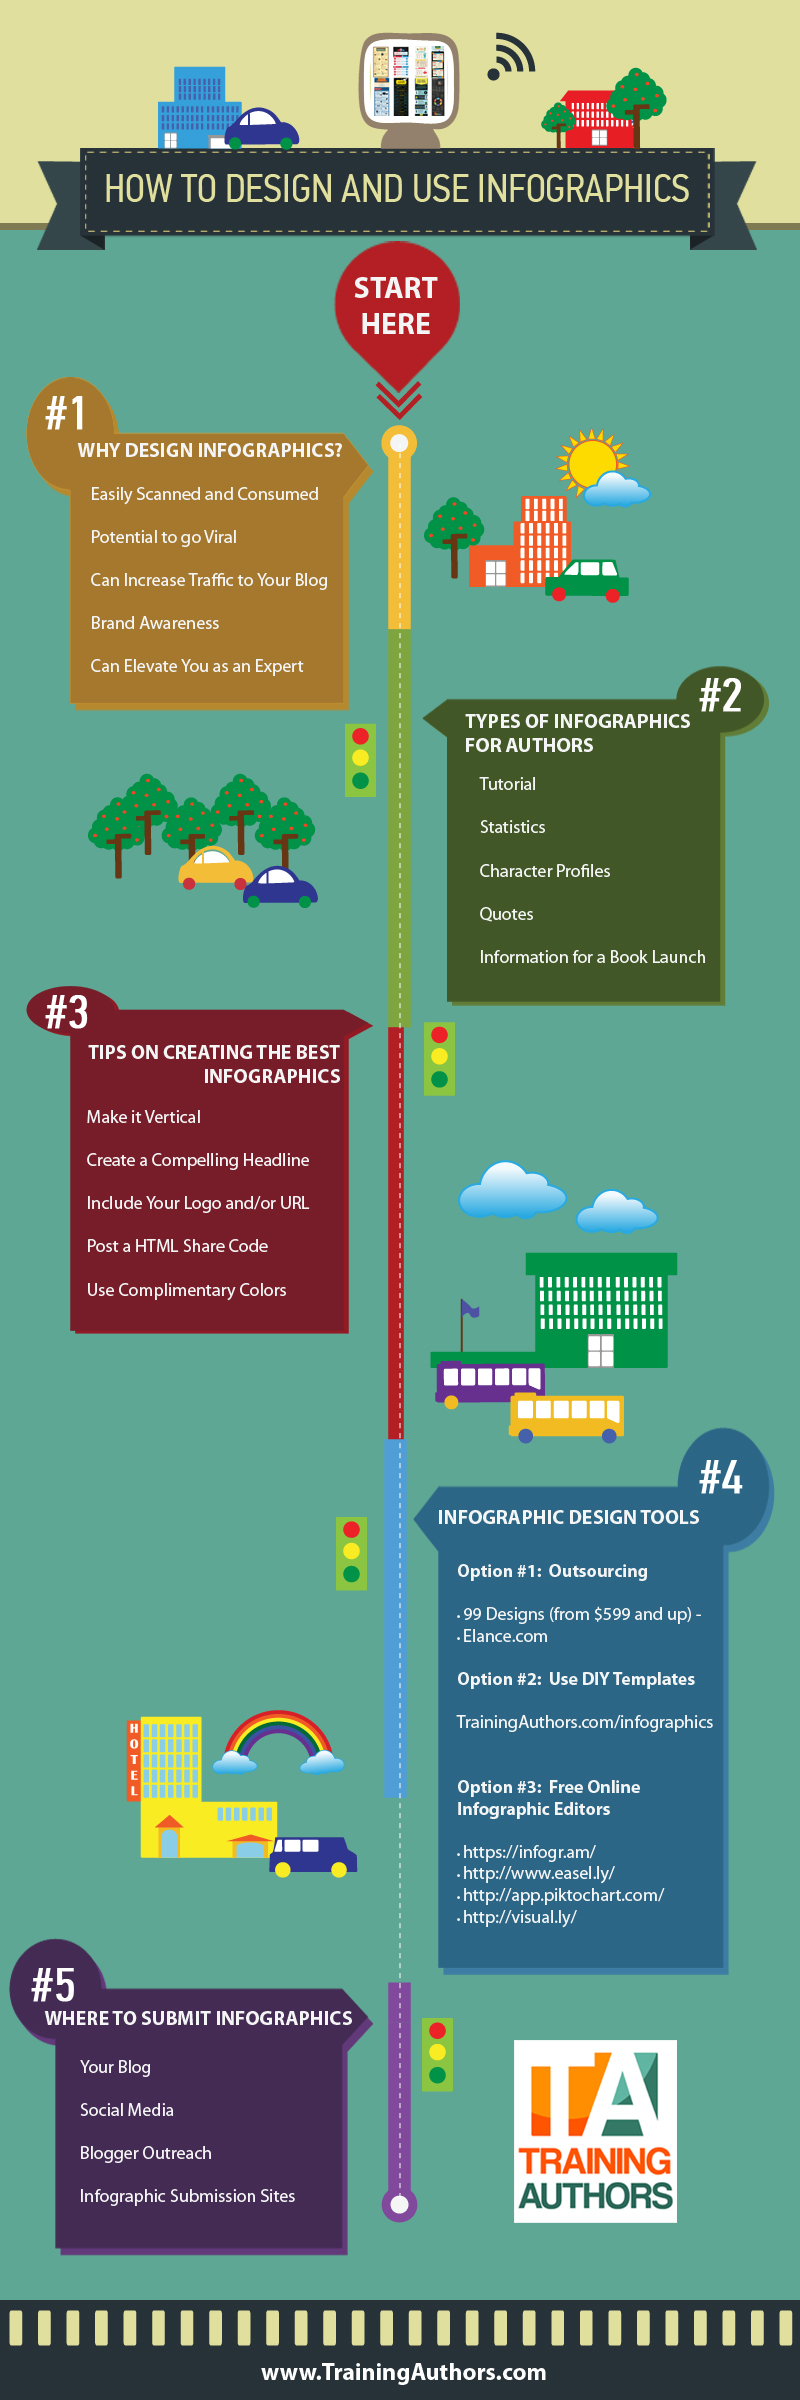
Infographics have seen an 800% increase since their inception. They are basically visual representations of any kind of data to make them easy to understand and have the ability to go viral.
A good infographic is always made in a vertical style with a compelling title. It should include the logo or URL of the designer who should make sure that it is readable as well as includes complementary colors and designs.
Mostly, infographics that are representing some sort of data are statistical in nature that includes graphs, pie charts, line diagrams etc so that the data is represented in a readable and easily understandable manner.