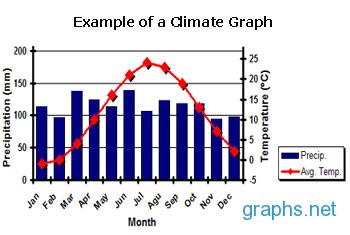
Climate graphs can be used to gain a better understanding of changing weather patterns.
These graphs are used to study temperature range, precipitation (rainfall or snowfall) and the pattern of precipitation.
One can depict only temperature, in a temperature graph with normal, record and observed high and low for the day or a season or consecutive years, depending on the time period of study.
Precipitation graphs can be used to depict the normal, actual and observed precipitation for any selected time period.
The basic model of a climate graph shows rainfall plotted as a series of bars while temperature is plotted as a curve.