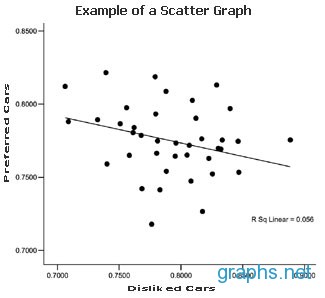
Scatter graphs help in plotting information about two related variables. They are used to visualize correlation and also the strength of the co-relation between the two metrics.
They are very much like the basic line graphs and require at least two numeric data attributes.
Scatter graphs are primarily used in Science to study relationships between two variables.
They clearly establish the data correlation and are one of the popular methods of illustrating non-linear patterns. One main advantage of scatter graphs is that they can demonstrate atypical relationships, which are generally unclear in other graphing methods.
They are used for data extrapolation and interpolation.
Some of the limitations of scatter graphs are that they cannot show relationship between more than two variables at one time. Also, if there are only few data points then they can produce incorrect results or graph analysis.