Submit Infographics

Home  »  Economy Graphs • Science Graphs • Static   »   World Water Day Statistics

World Water Day Statistics

world water day statistics

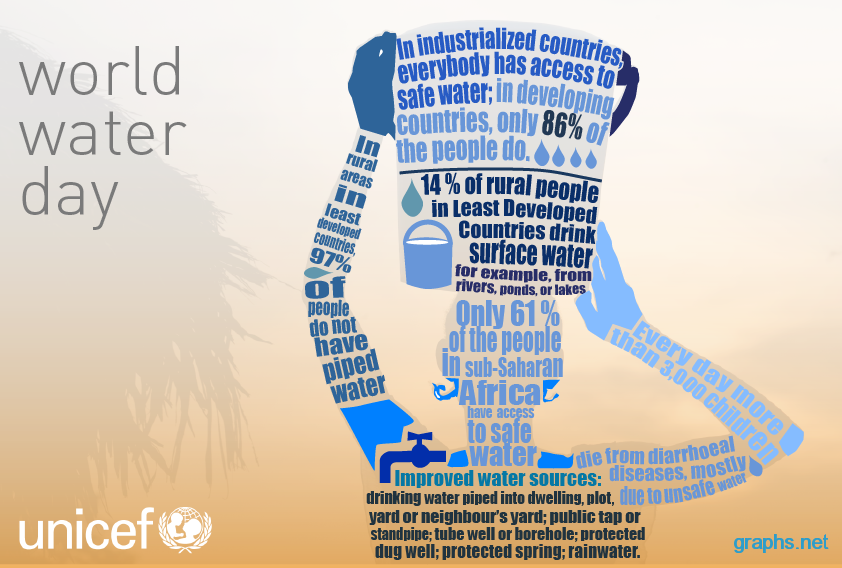
While the people in developed nations have access to safe water, in developing countries only 86% do.Another thing is 97% people in rural areas in least developed countries do not have access to piped water and 14% drink surface water like from ponds, lakes or rivers.

Another fact states that in sub-Saharan Africa, only 61% people have access to safe water. Another gruesome fact is more than 3,000 children die from diarrhea every day due to lack of safe drinking water.

Categories : Economy Graphs, Science Graphs | Published by : graphs | Date : Jun 27, 2012
Tags: safe drinking water facts, safe water facts, safe water statistics, world water day facts, world water day history, world water day info

Credits

Source : http://bojoda.com/tag/unicef/
Add missing credits


Related Posts

What’s Causing Global Warming
London Summer Olympics Top Apps


Copyright 2023 Graphs.net
i i i
  • Contact
  • Terms of Use
  • Privacy Policy
Scroll Up