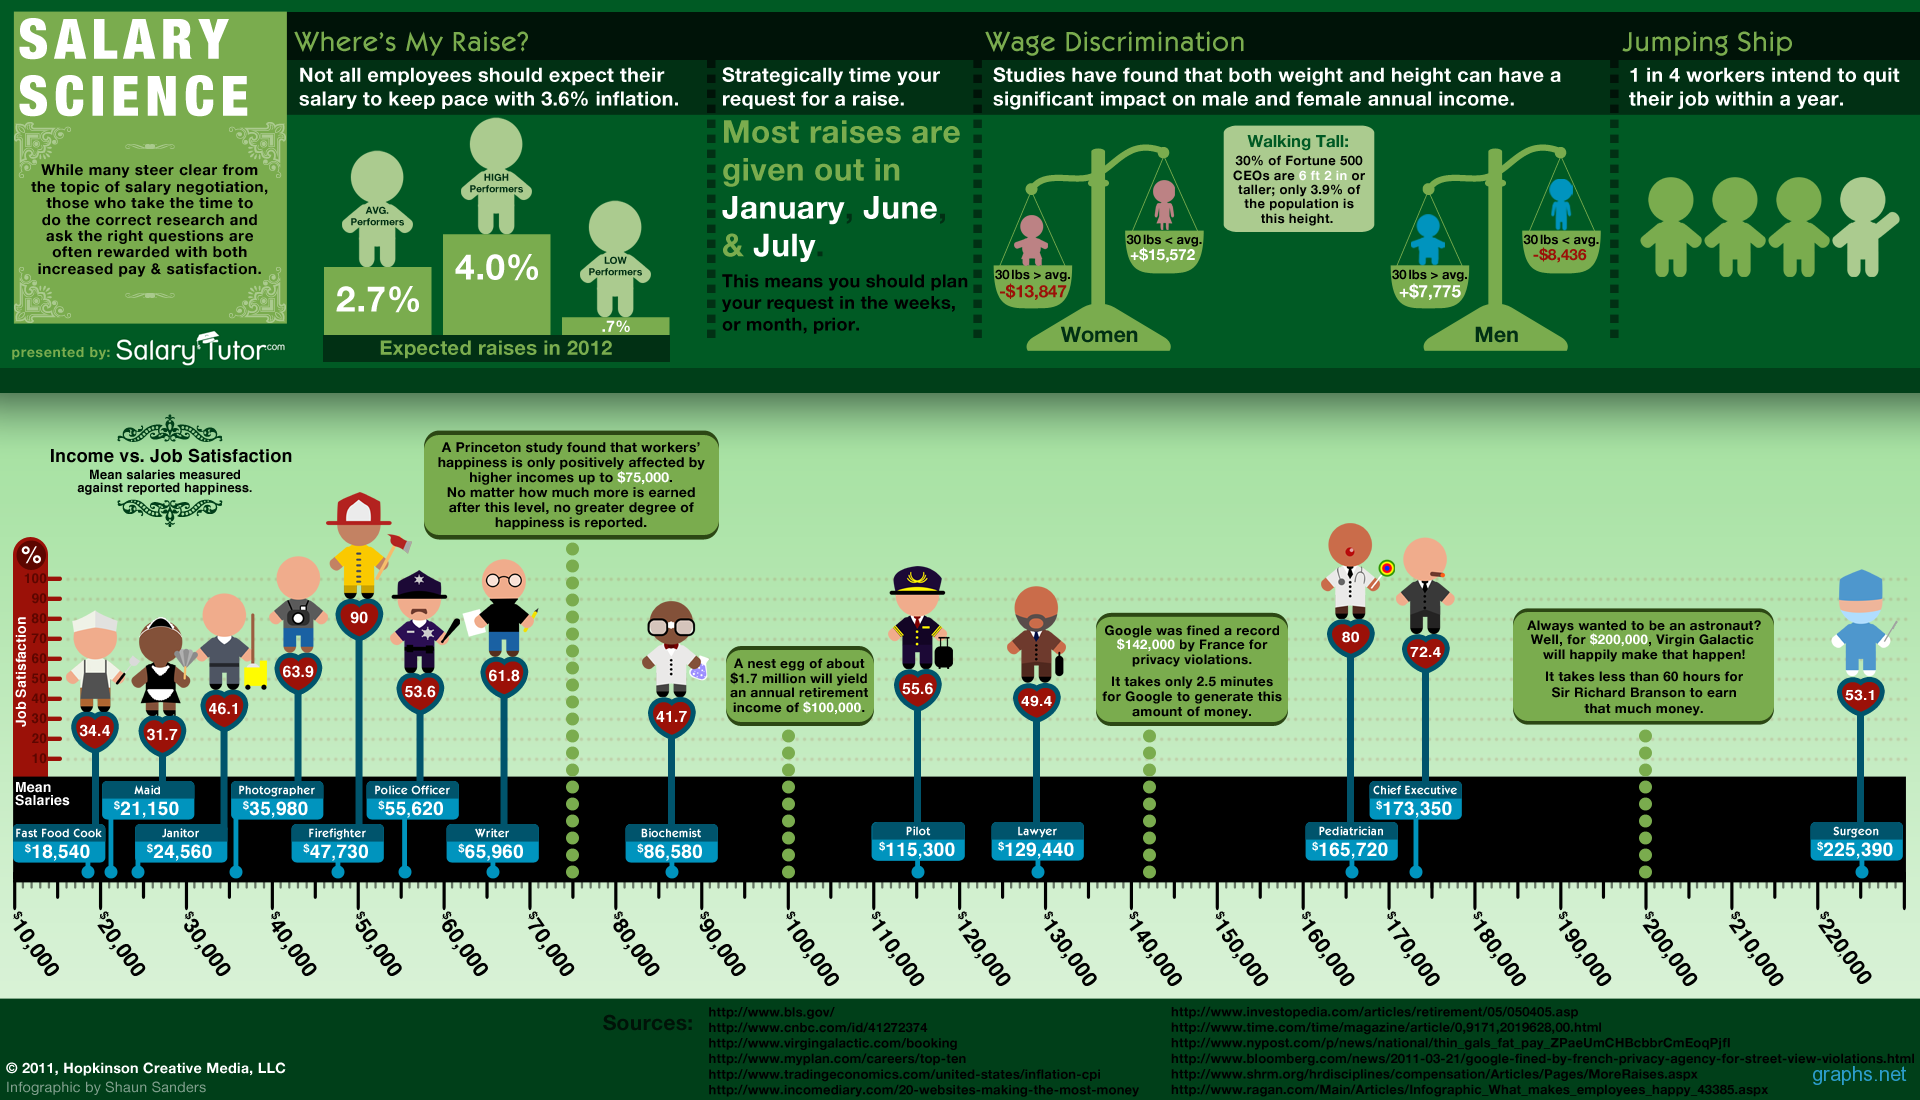
When it comes to salary negotiation, many try to steer clear away from it but the one who actually gets a pay raise is the person who asks the right question at the right time. One should strategically plan to request for a raise when it is time for the company to usually give a pay raise.
It is a fact that your annual income may depend on your height and weight. For a women if you are 30 lbs more than average then your annual income may be less than $13,847 and for overweight men there annual income will be less than $8,000. On a scale 0f 1-100%, only the firefighters have 90% job satisfaction with the annual income of $47,000+. Even though surgeons earn more than $225,000, their satisfaction with their job is only 53.1%.
Asking for a raise is a delicate matter, nevertheless one should ask for it when it is due.