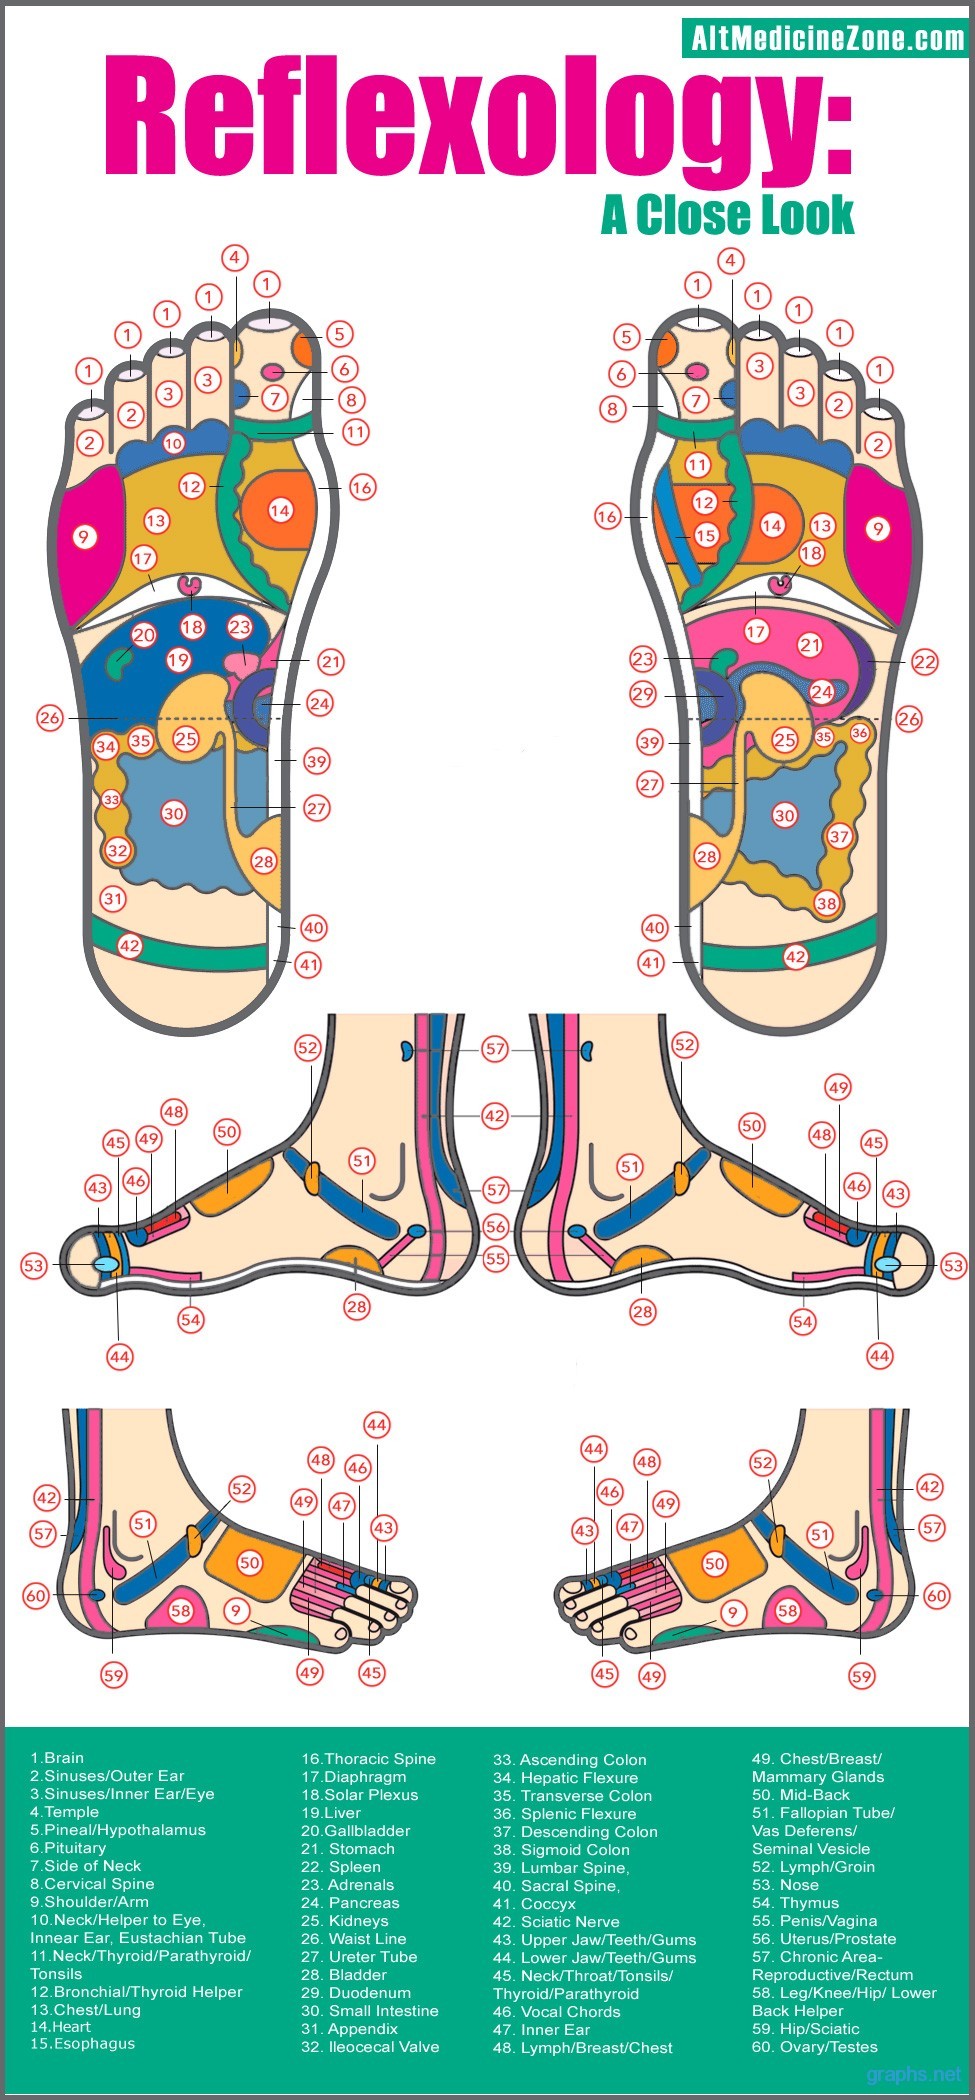
Reflexology is an alternate method of medicine which involves the application of pressure onto the hand and feet as well as other specific ares of the body without the use of any kind of lubricant or oil through which the reflex areas of the body are relaxed.
Reflexology was first introduced in the US by Dr. William H. Fitzgerald and and Dr. Edwin Bowers, in the year 1913 claiming that reflexology makes use of the pressure to open up the blockages in the life force in our body, something that the Chinese effectively call 'Qi', thereby healing the body as a result.
All throughout our body there are about 60 reflex point that when massaged or pressurized properly relieve the pain or discomfort in the area that they correspond to.