Transportation has always been a key existential need for human beings. For us humans, the urge to be able to move across distances both small and vast has made us wander and migrate across continents all through our history on this planet. Ever since we invented the wheel, we have never looked back and have created numerous vehicles since then that take us over land, sea and air with much speed and convenience. Nowadays, transportation has evolved to help us travel across cities, states and countries using a variety of modes.
1. Public Transportation
Public transport has made life easier for many and the benefits drawn from Public transports are numerous that start from monetary to environmental safety. It is observed that the places where people rely heavily on public transport see less traffic congestion and road accident cases.
Source
2. Commuting To UCLA
Commute behaviour of UCLA transportation is observed by the UCLA community. Almost 56,000 employees and students commute to UCLA campus on a regular basis and this number is sufficient to fill 30 Royce halls. 74% of commuting students and 47% of all UCLA employees are alternative commuter.
Source
3. The Hot Debate Between Airbus And Boeing
In the airline industry airbus and Boeing are the top competitors. Boeing 727 were into production in from the year 1970 where as Airbus was started from 1916. The headquarters of Boeing is in Toulouse France where as Airbus is headquartered at Chicago USA. Boeing has almost 59,000 employees working with them and the number of employees with Airbus is 170,000.
Source
4. What Moves Us?
The industry, commerce and everyday’s life in UK is connected by the bus, trains and private vehicles that criss-cross all across the country. In the year 2010-11 the largest money spent on public transportation was on railways.
Source
5. Bus WiFi And The Changing Face Of Public Transportation
The way public transport industry has been attracting the riders are changing rapidly and the increasing demand of WiFi services on public transports are motivating the groups and companies to equipped the public transports with these services.
Source
6. Attack Of The Self-Driving Cars
Very soon the auto driving vehicles will touch the roads and change the way the transportation takes place in present times. 4 states have already passed rules for the self driving vehicles.
Source
7. Better Transportation Options
People trying to travel through public transport walk almost 19 minutes to and from for catching the public transports. The countries that have more number of people who walk or cycle to their destinations tend to have lower rates of obesity. With every additional mile spent in the car increases 6% of the chance of obesity increase. In the year 2010 more than 30,000 people died in car wrecks.

Source
8. The Evolution Of The American Van
Over the years the American society has experienced huge impact of the van as the mode of transportation. Van was actually the first four wheeled vehicle that allowed the transportation of many people in one vehicle.
Source
9. The Most Dependable Cars On The Road Today
Top safety picks in the year 2012 are mini cars like fiat 500, Honda fit and Ford Fiesta. In the mid sized car categories the most popular vehicles are Audi A3, Buick Verano and Chevrolet Malibu.
Source
10. A Decade of Rail Fare Hikes In The UK
Over the past decade UK rail fares have risen up to 20% more as compare to the salaries in the country. Many travellers in UK have seen the rise of almost 50% in their rail fares in last 10 years. The average pay increase in UK is just 21% as compare to the increase in the fare.
Source
11. The US Work Commute By The Numbers
Shorter, cheaper and less stressful commute is the dream of many people but 86.3% people transport through car, trucks and van. Only 5.2% people make use of public transport where as 2.8% prefer walking and only 0.5% use their bicycle for commuting.
Source
12. Planes, Trains And Automobiles
Almost one in six American moves each year and sometimes the stress of such exhaustive move could be overwhelming. People try to find new routes and get acquainted with new roads and methods for transportation. Around 37 million American moves every year and 12% of them move out of the state. 44% people move for a new location or house, where as 30% people relocate due to family reasons like marriages. 16% move as they accept a new job and 10% people move due to various other reasons.
Source
13. The Brands We Drive
The home for the largest passenger vehicle market is United States. On the American roads more than 254 million registered vehicles are running at the moment. Some of the popular vehicle brands are Nissan, Hyundai, Ford, Honda, Toyota, Chrysler and Chevrolet.
Source
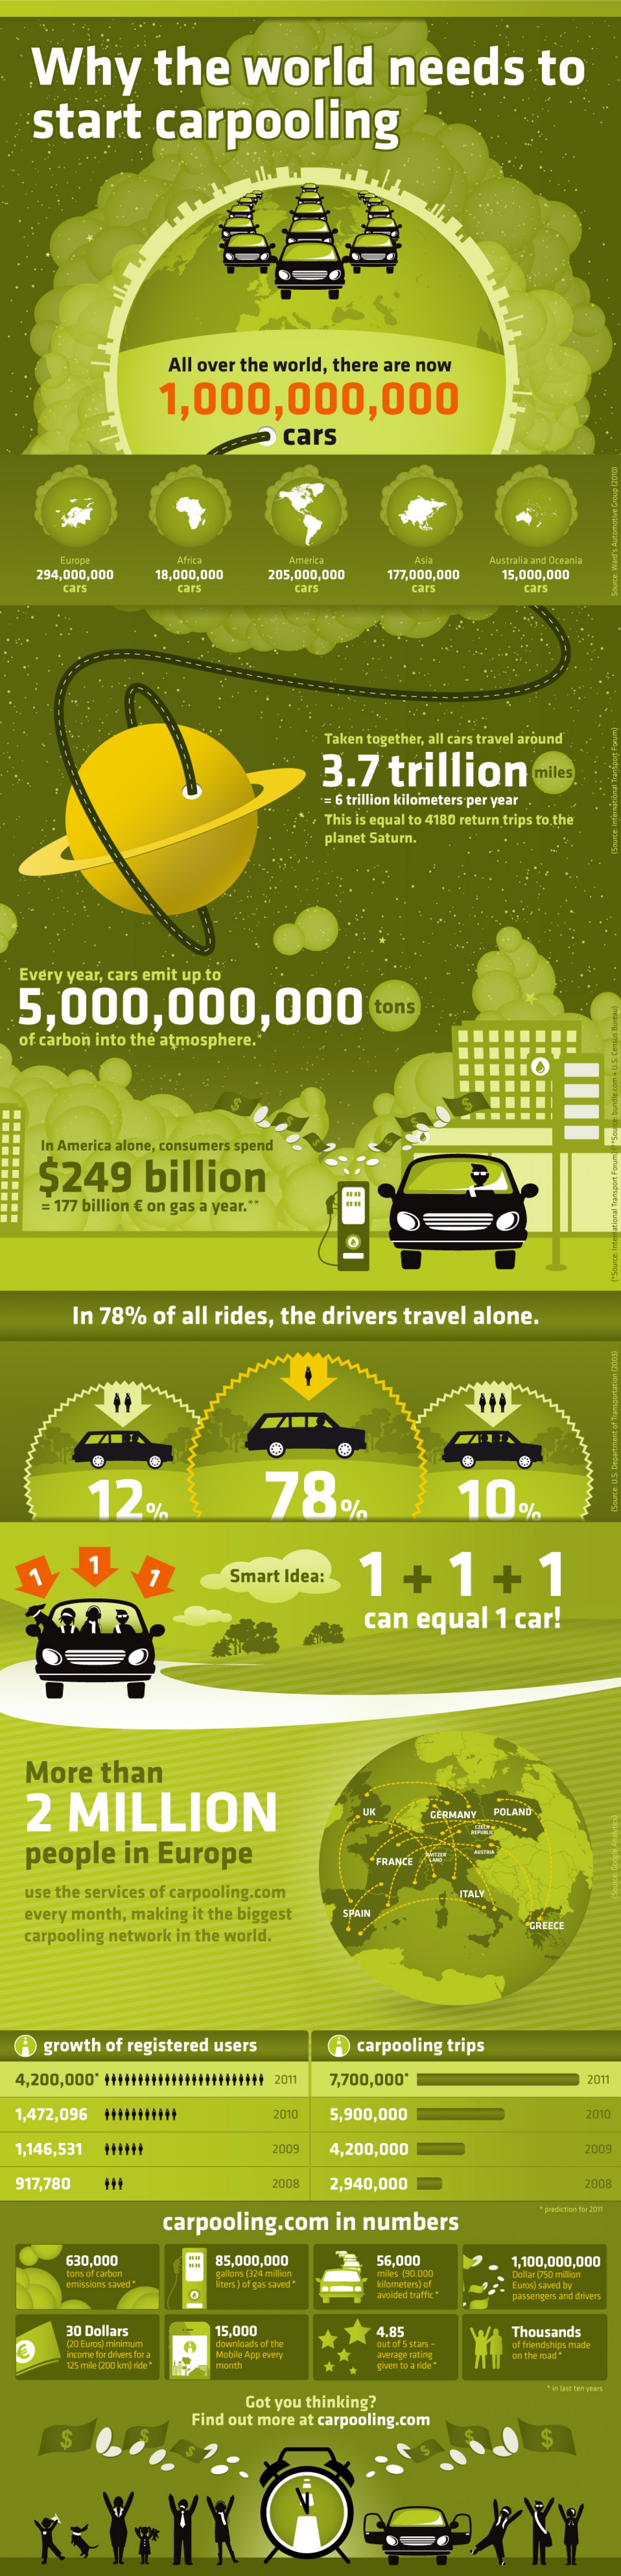
14. Why The World Needs To Start Car-sharing
78% of all the car journeys are done just by a single person driving the car. This is a sheer example of massive misuse of energy, fuel, space and money. Car sharing or pooling schemes are aimed at solving this trouble of energy wastage. There are more than 1,000,000,000 cars all over the world. All the cars together travel almost 3.7 trillion miles in a year.
Source
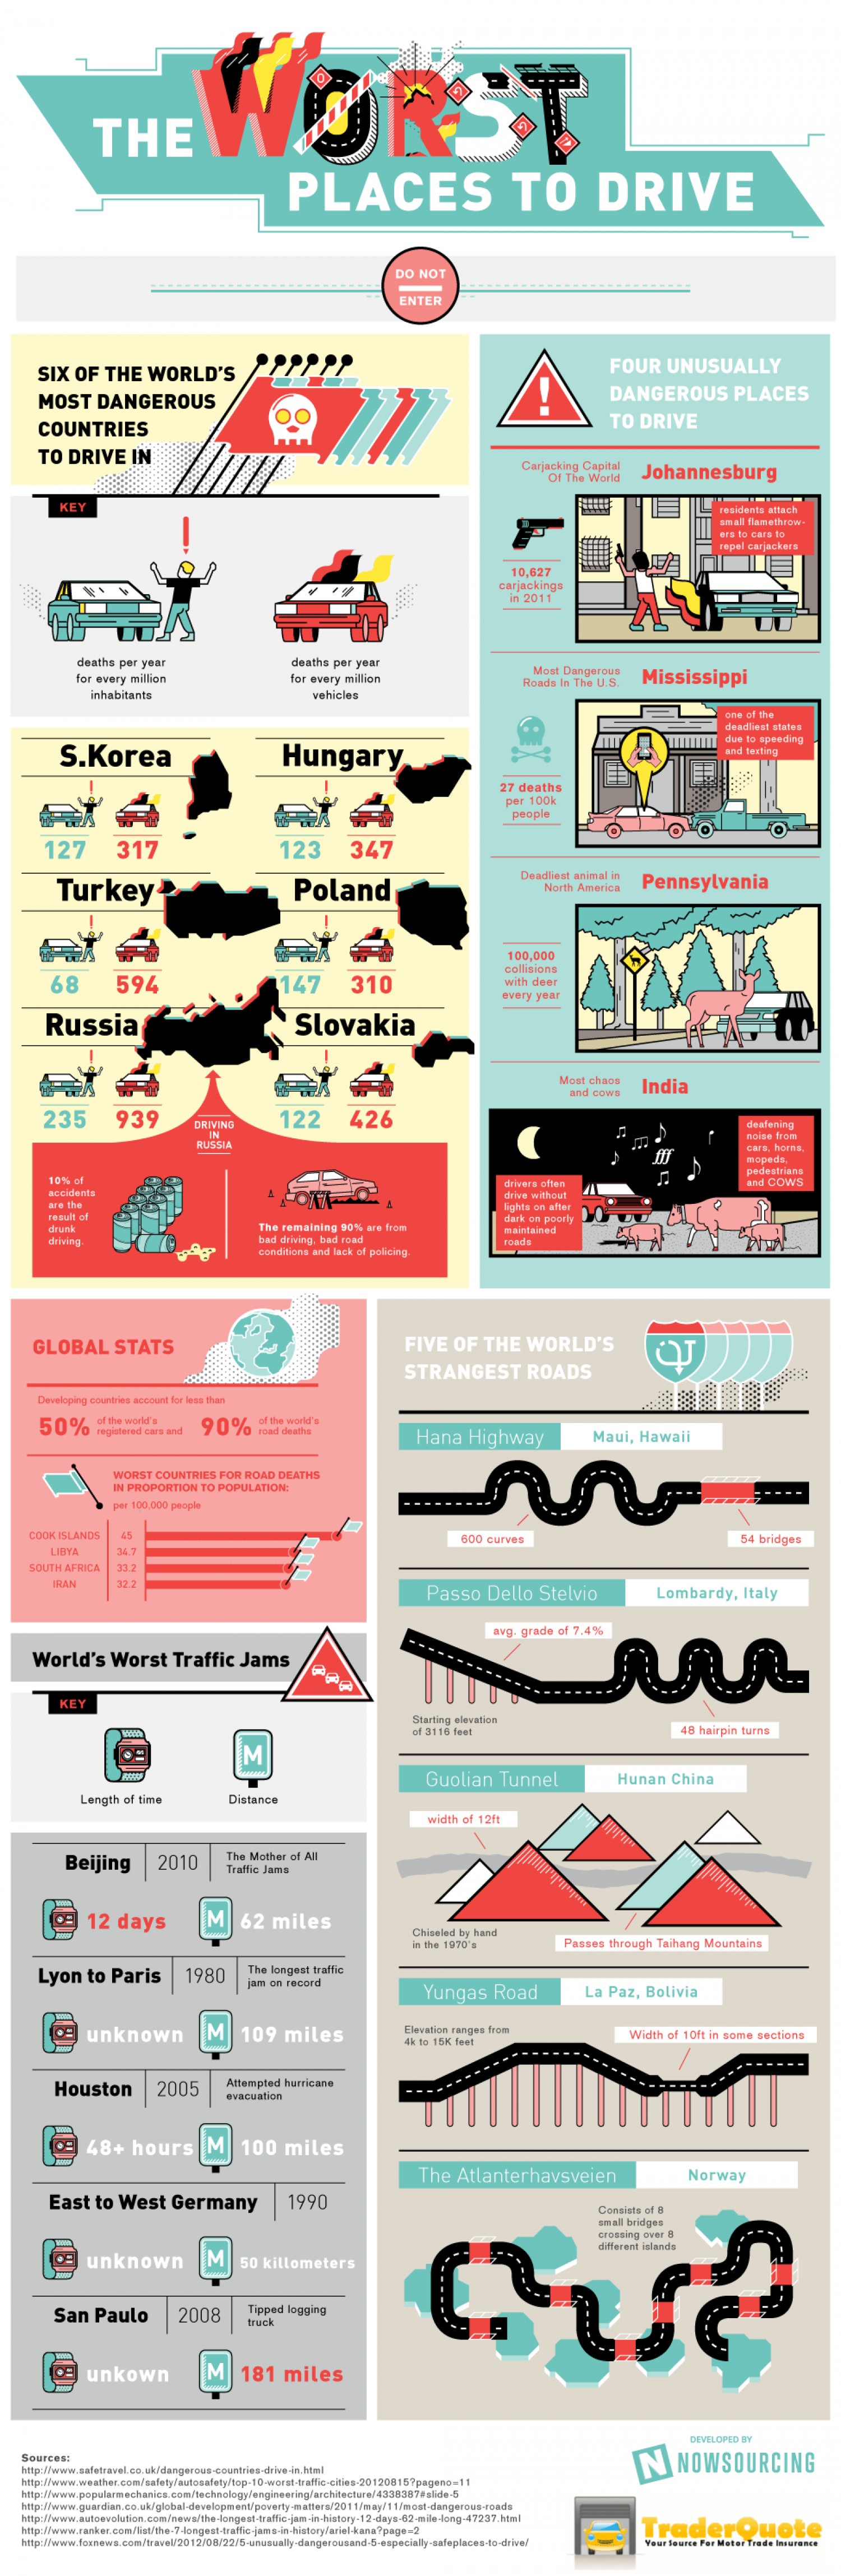
15. The Worst Places To Drive
Six of World’s most dangerous countries to drive a vehicle are Hungary, South Korea, Turkey, Poland, Russia and Slovakia. In Pennsylvania almost 100,000 collisions happens due to deer each year. In India the chaos on the road is created by animals like cows and buffalos and driver drive their vehicles without proper lights on the poorly maintained roads.
Source
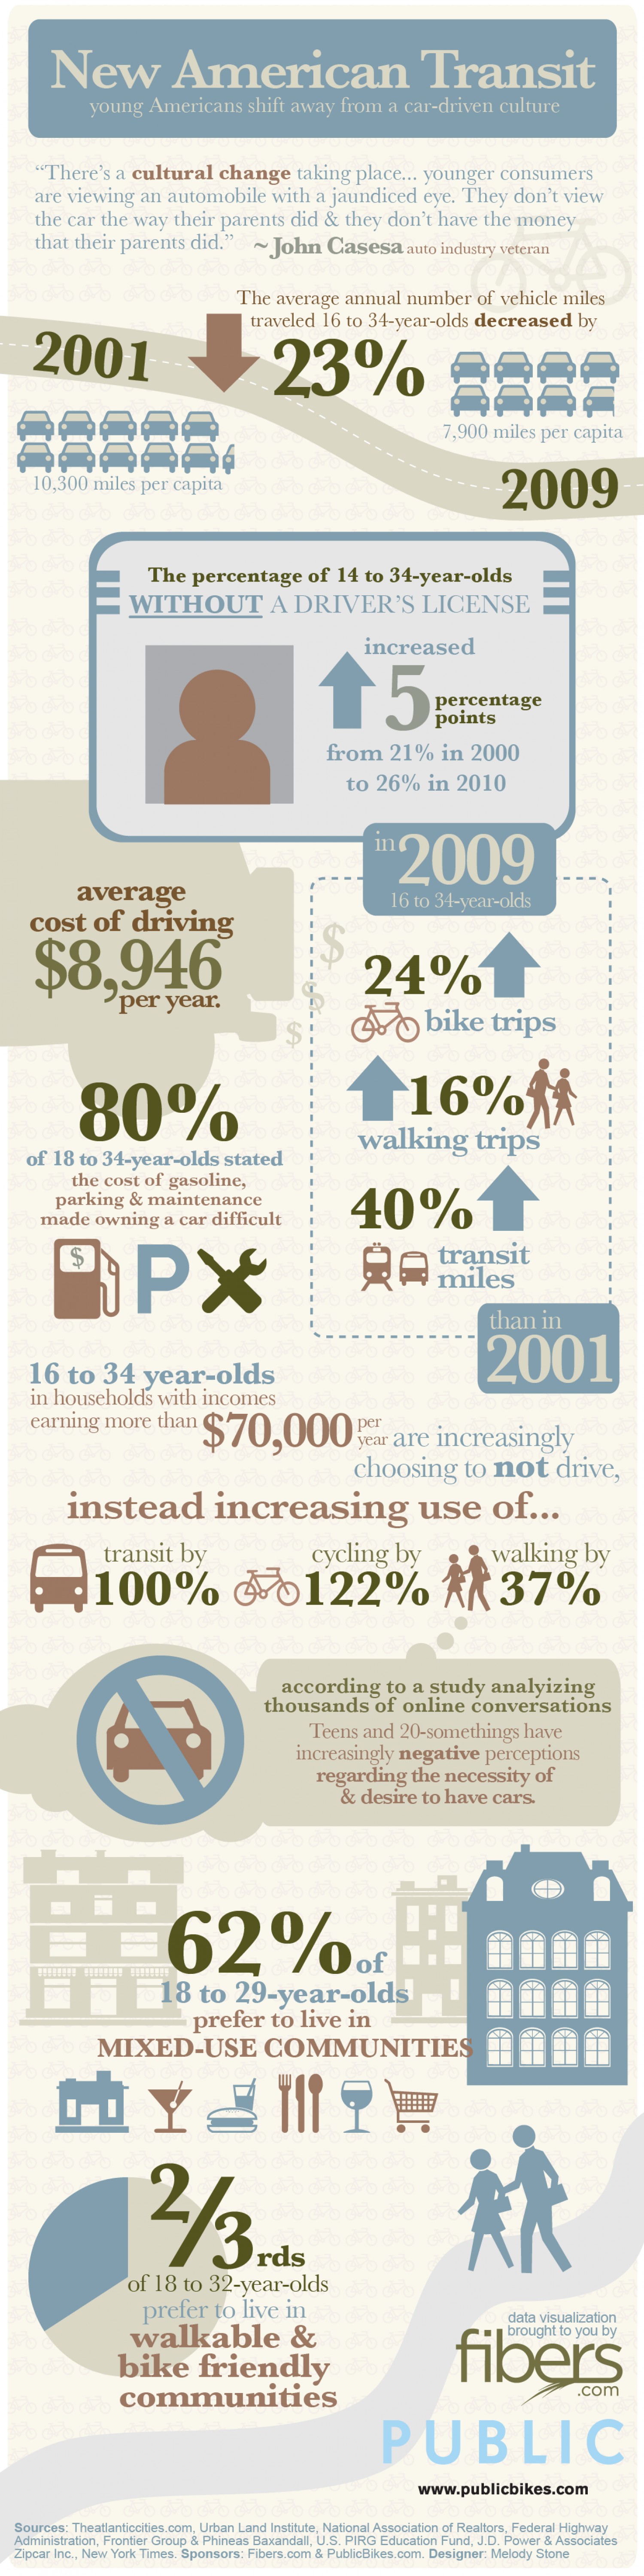
16. New American Transit
American youth is shifting from more cars driven culture to a walking and biking culture in order to save the earth and lead a healthy life.
Source
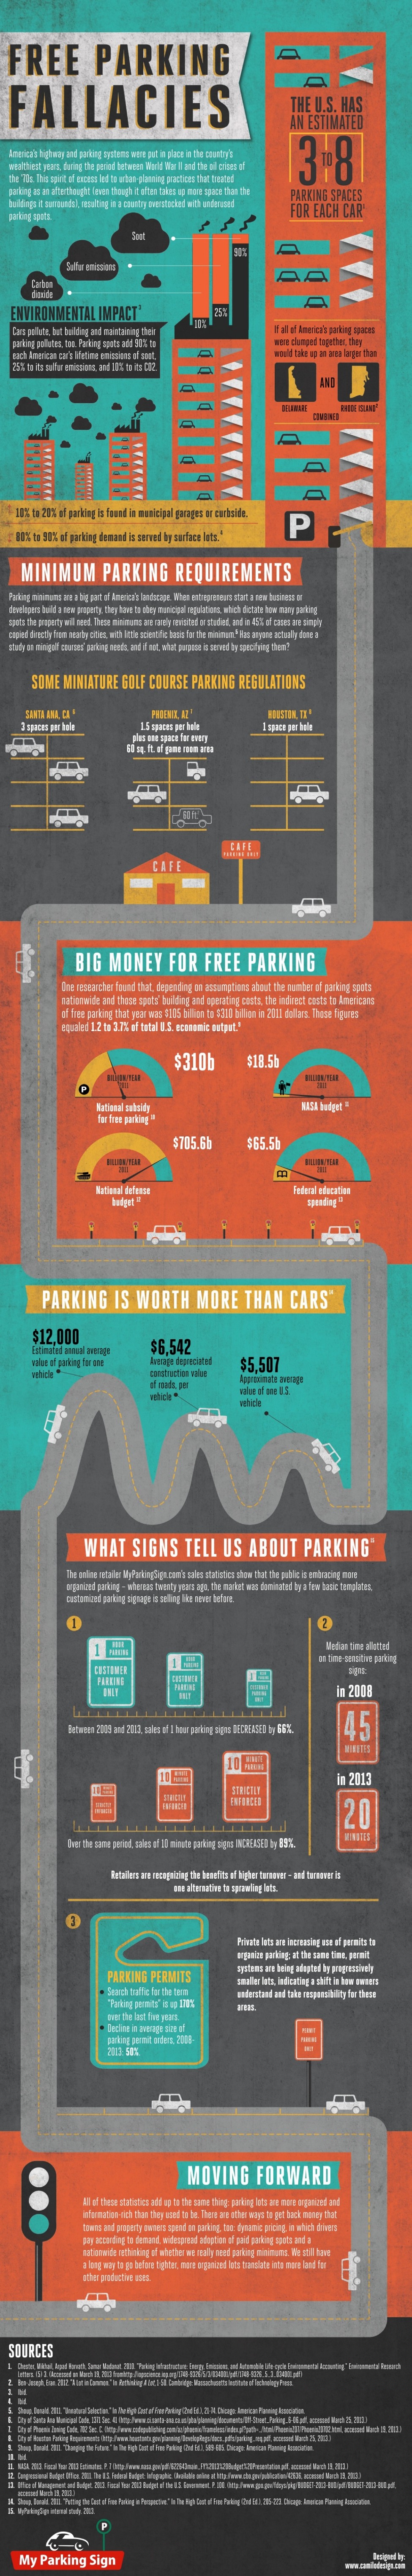
17. Free Parking Fallacies
American parking place were created in the wealthiest years of the country that has led to unused and overstock parking spaces all over the country.
Source
18. Transportation In The Recession
Any kind of transportation in America is a significant budget item and during the year 2008 and 2009 America witnessed a massive decrease in vehicle sales due to recession. The number of Vehicles sold in March 2008 was 1,356,926 where as the number of vehicles sold in March 2009 was 857,735 that led to almost 38.3% decrease in the sales of the vehicles.
Source
19. Busiest And Largest Airports In The World
UK has many airports that fall in the category of busiest airports all over the World. Total number of passengers handled in UK airport in 2009 was 218,645,809.
Source
20. The History of Transportation
In the 3500 BC the first wheeled vehicles were invented and in 2000BC horses were domesticated and used for transportation. In 1740 Clockwork carriage was the most popular vehicles used for transportation.
Source