Money is one of the most important and integral part of our lives and it is highly impractical to imagine a life without money. While it is important to save money, it is also only as important to spend it for the necessities such as rent, groceries, clothes, automobiles etc. Let’s read some interesting facts and stats about money.
1. The Pocket Money Index
It is a fact that children are saving more money than their parents and the top jobs for children are helping with gardening, general cleaning of the house, cleaning the car, hovering and tidying the bedroom. Children spend their pocket money on Lego, pets, books and electronics.
Source
2. The Future Of Money: A Global Currency
About 1900 local communities in the world are now issuing their own currency. The world inflation was found in Zimbabwe and this can be understood from the fact that in 2008, the inflation was so bad that it took $66 billion Zimbabwe dollars to buy 1 US dollar.
Source
3. The Power Of The Extra Dollar
Some ways which can help you improve your credit score are by paying your bills on time, keeping your debt at less than 30% of the total credit limit, avoiding bankruptcy, maintaining a long credit history and closely monitoring your credit.
Source
4. How Men And Women Spend Money Differently?
Over 63% women indulge in retail therapy to boost their moods whereas only 39% men do the same. When depressed, women shop for books, clothes, food, shoes and accessories whereas men shop for food, electronics, games, clothes and music etc.

Source
5. The Ultimate Money Test
Over 1000 people took the ultimate money test to see how well they would score for their knowledge and behavior towards work and economy. Out of these, 47% people passed whereas it was found that more than 62% Australians believed that homeownership is important.
Source
6. Creative Money Savers For Newlyweds
Half of the first marriages in US end up in divorce and money is the number one reason behind this. So the good idea is to save money with creative ways like getting the wedding sponsored, painting your roof with reflective paint, tightly packing a freezer, lowering the thermostat during winter, and displacing the water in the water tank.
Source
7. Where’s The Money In America
The top 1% of households holds 34.6% of all the privately held wealth in America. It is a fact that 91.9% Americans receive no inheritance and there are 572000 millionaires in California alone. Missisippi has the lowest rate when it comes to having millionaires.
Source
8. Real Money, Virtual Wallets
55.8% Americans do not use a website to manage their finances and 72.8% Americans do not use their Smartphones or apps to manage their money. Some of the best money management apps are mint, spendee, pageonce, expense manager, dollarbird and moneywise.
Source
9. What Is Middle Class Income?
61% of American households were considered middle income in the year 1970 but in 2012, this percentage became 50%. The average American family spends 31.5% of their money on rent, 8.6% on groceries, and 5.7% on dining out, 5.7% on cars, 5.3% on gasoline and 5.4% on utilities.
Source
10. History Of American Paper Money
The first ever paper currency was launched in the year 1690 in America and the first US dollar came into being in the year 1785. In 1862, the first $2, $50 and $100 bills were launched while it was only in 1957 that ‘in god we trust’ were written on the notes.
Source
11. How The Brits Score At Saving Money
51% Brits consider themselves good at saving money while 75.8% would haggle at the market. Infact 14.1% Brits would even haggle at a designer store. Most even would rather save on fashion and holidays than anything else and getting rid of expensive habits is the number 1 way to save.

Source
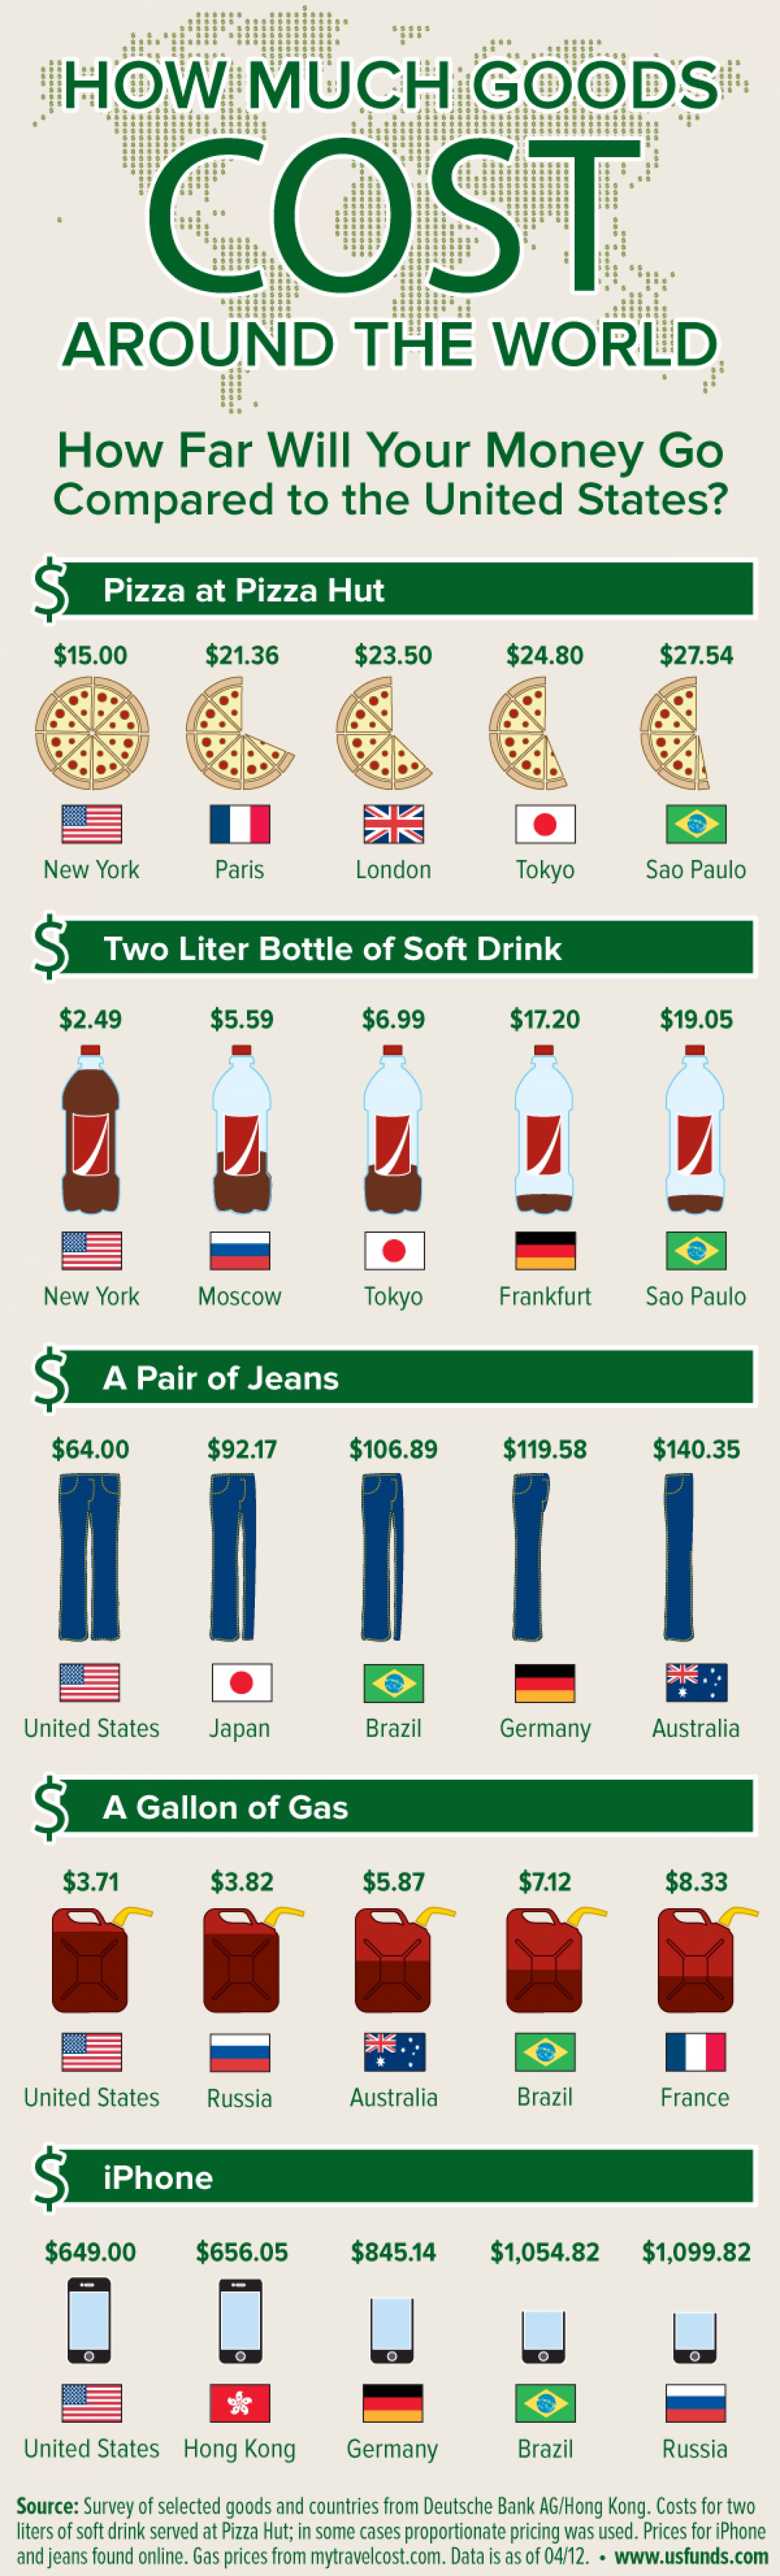
12. How Much Goods Cost Around The World
A pizza costs $15 in New York, $23.50 in London and $27.54 in Sao Paulo.2 litres of soft drink cost $17.20 in Frankfurt and $2.49 in New York. Infact a pair of jeans costs twice as much in Australia than it costs in United States. iPhone costs $1099.82 in Russia while it costs $649 in USA.
Source
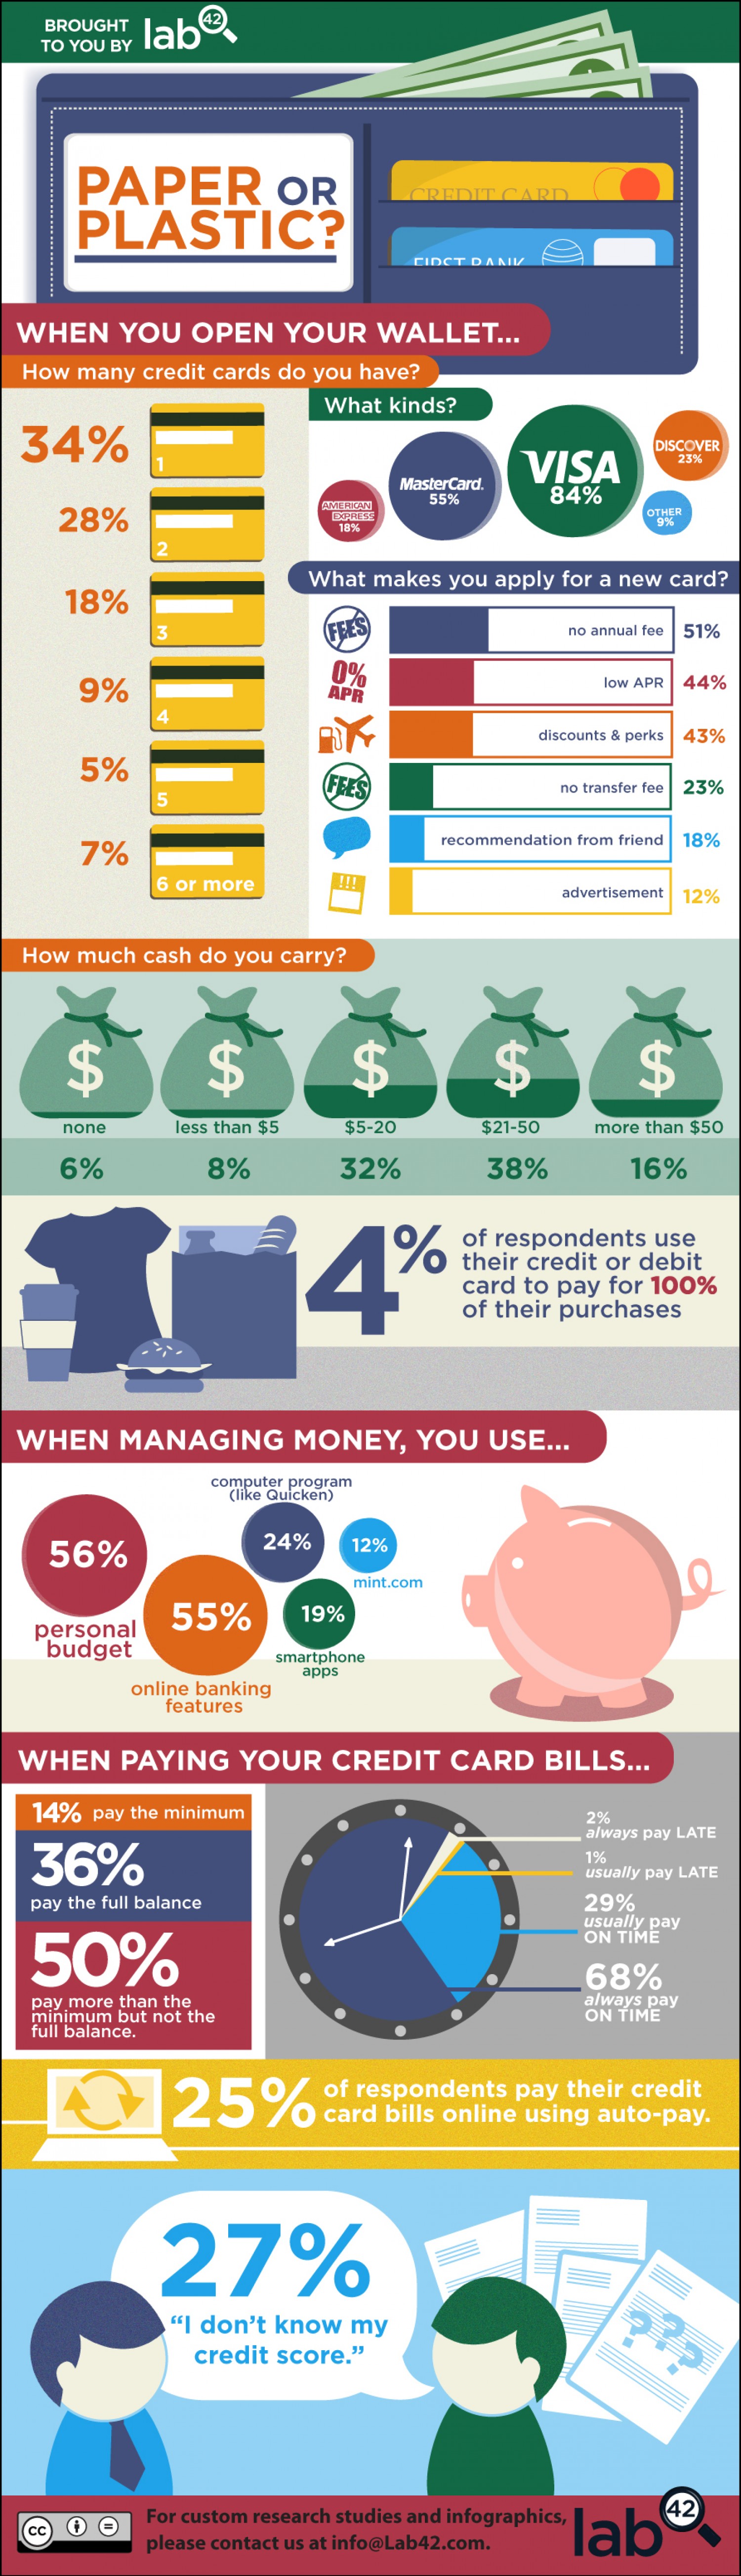
13. Paper Or Plastic
About 84% people have a Visa credit card, 55% people have a MasterCard and 23% have Discover credit card. About 4% respondents of a survey said that use their credit or debit card to make 100% of their purchases! 25% of the respondents pay their credit cards bill online using auto-pay.
Source
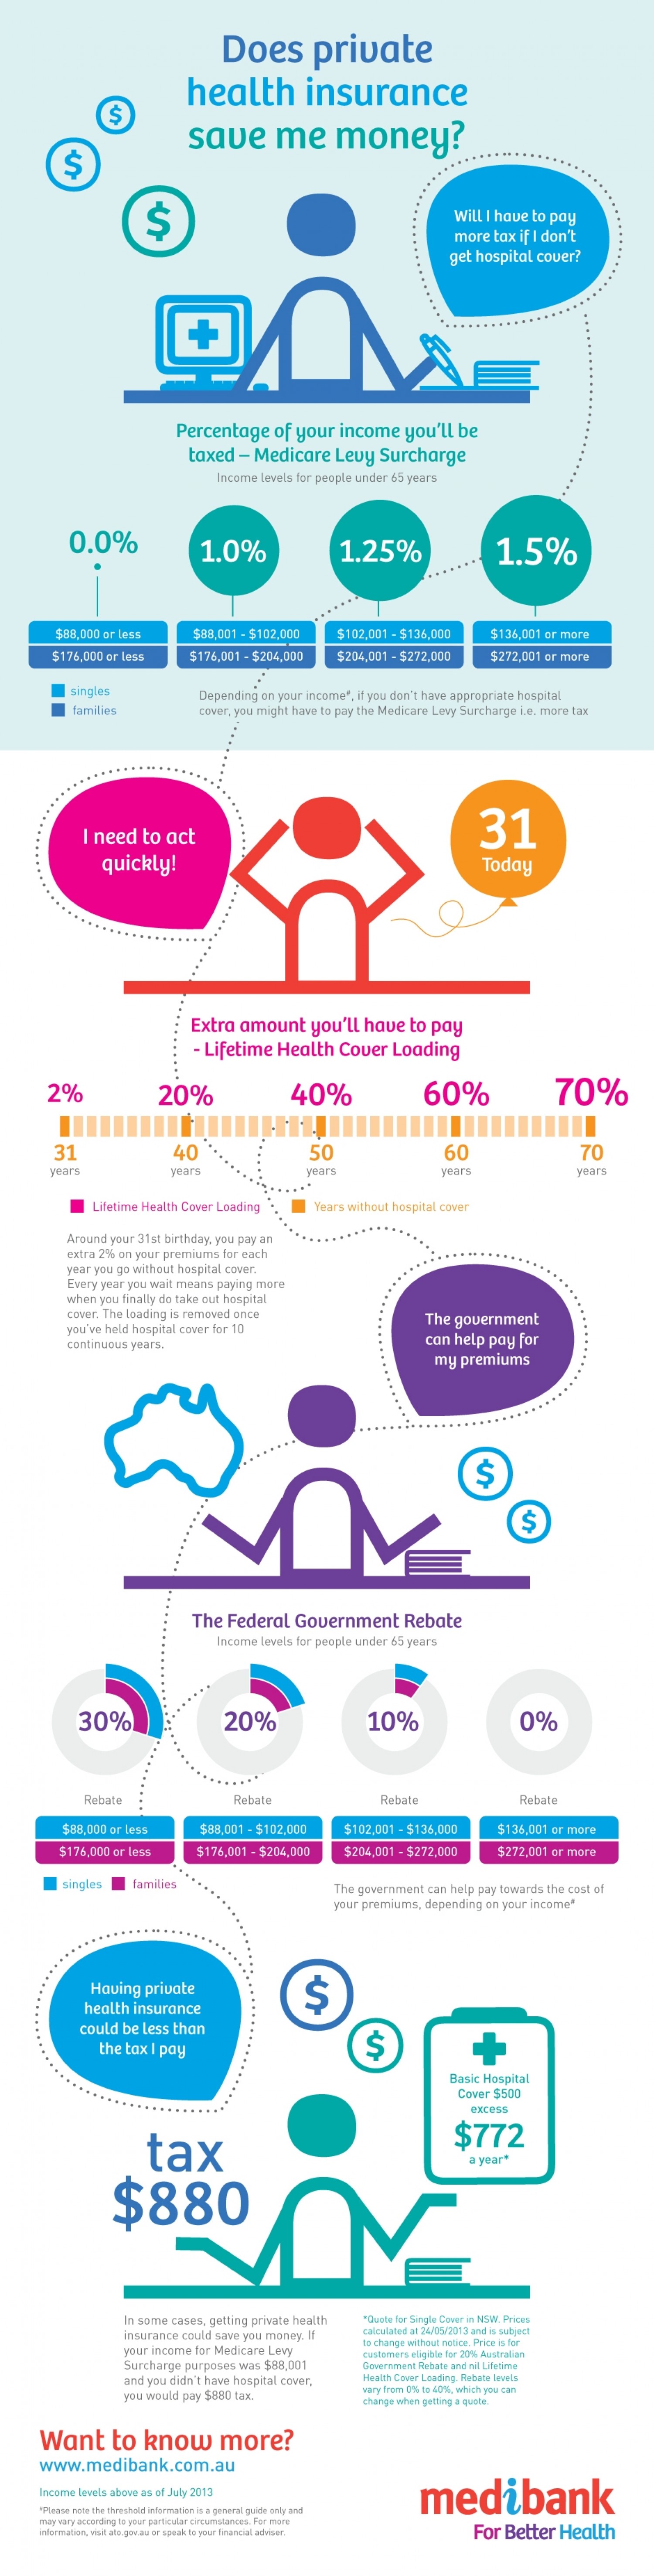
14. Private Health Insurance And Savings
It is a fact that private health insurance helps people save money and if one doesn’t have an appropriate hospital cover, they may be required to pay more tax. This means that if you are 31 and don’t have a health insurance they you would have to pay extra 2% premiums for each year that you go without the cover.
Source
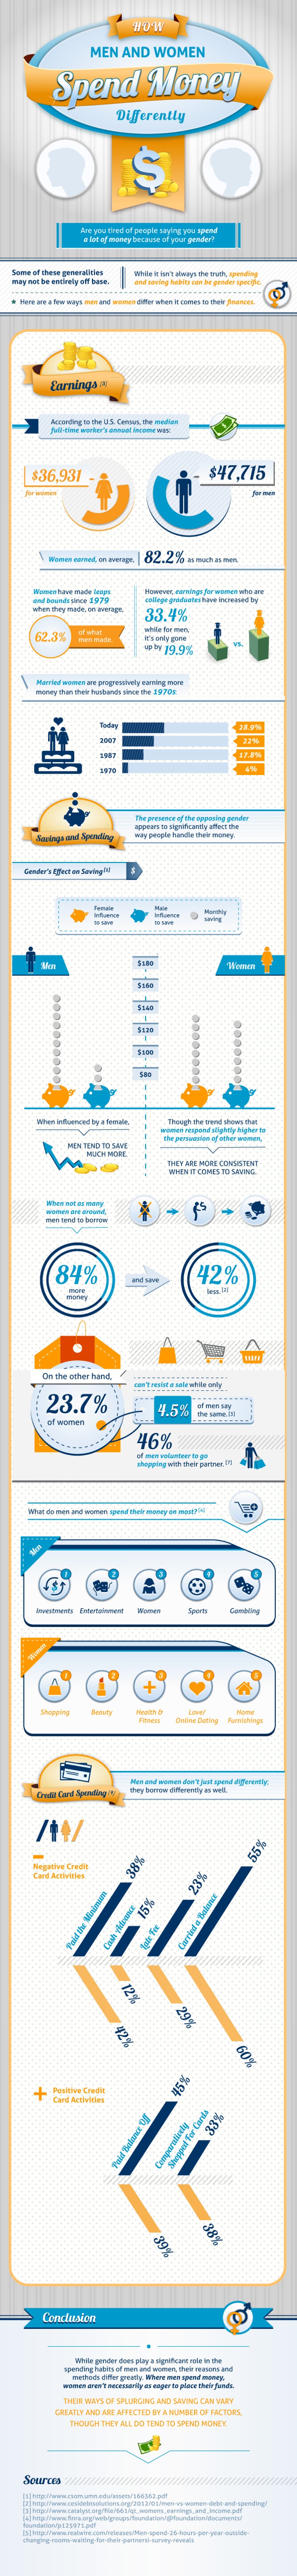
15. How Differently Do Men And Women Spend
Women on an average earned 82.2% as much as men and married women are earning more money than their husbands since 1970. Men spend their money on investments, entertainment, women, sports and gambling while women spend on shopping, beauty, health and fitness, online dating/love and home furnishings.
Source
16. Counterfeit Currency
In 2011, 3028 people are arrested for counterfeiting US currency while in 2002; 121.8 million dollars were intercepted outside of the US. In Canada, Ontario and Quebec are the two biggest provinces for counterfeiting while in Central Florida, $20000 is removed weekly.
Source
17. Christmas Spending
This year, one in ten people are planning to use loyalty cards and vouchers to shop for Christmas and 59% will pay in cash. 77% are not prepared to get themselves in debt this Christmas and 77% will be tucking into turkey this Christmas.
Source
18. Attractiveness vs. Money
30% of men think that women find a high salary very attractive while 2% women think that men find high salary/lots of money very attractive. Some of the greatest desires of men from women were sense of humor, good looks and intelligence.
Source
19. Men Fear Money
Indians are very particular about saving money and it is a fact that the gross national savings of UK are 12.35% while the gross national savings of India are 34.16%. Indians across all income groups are using tools like perfios to manage their money. Perfios is a leading online money manager with over 250000 users.
Source
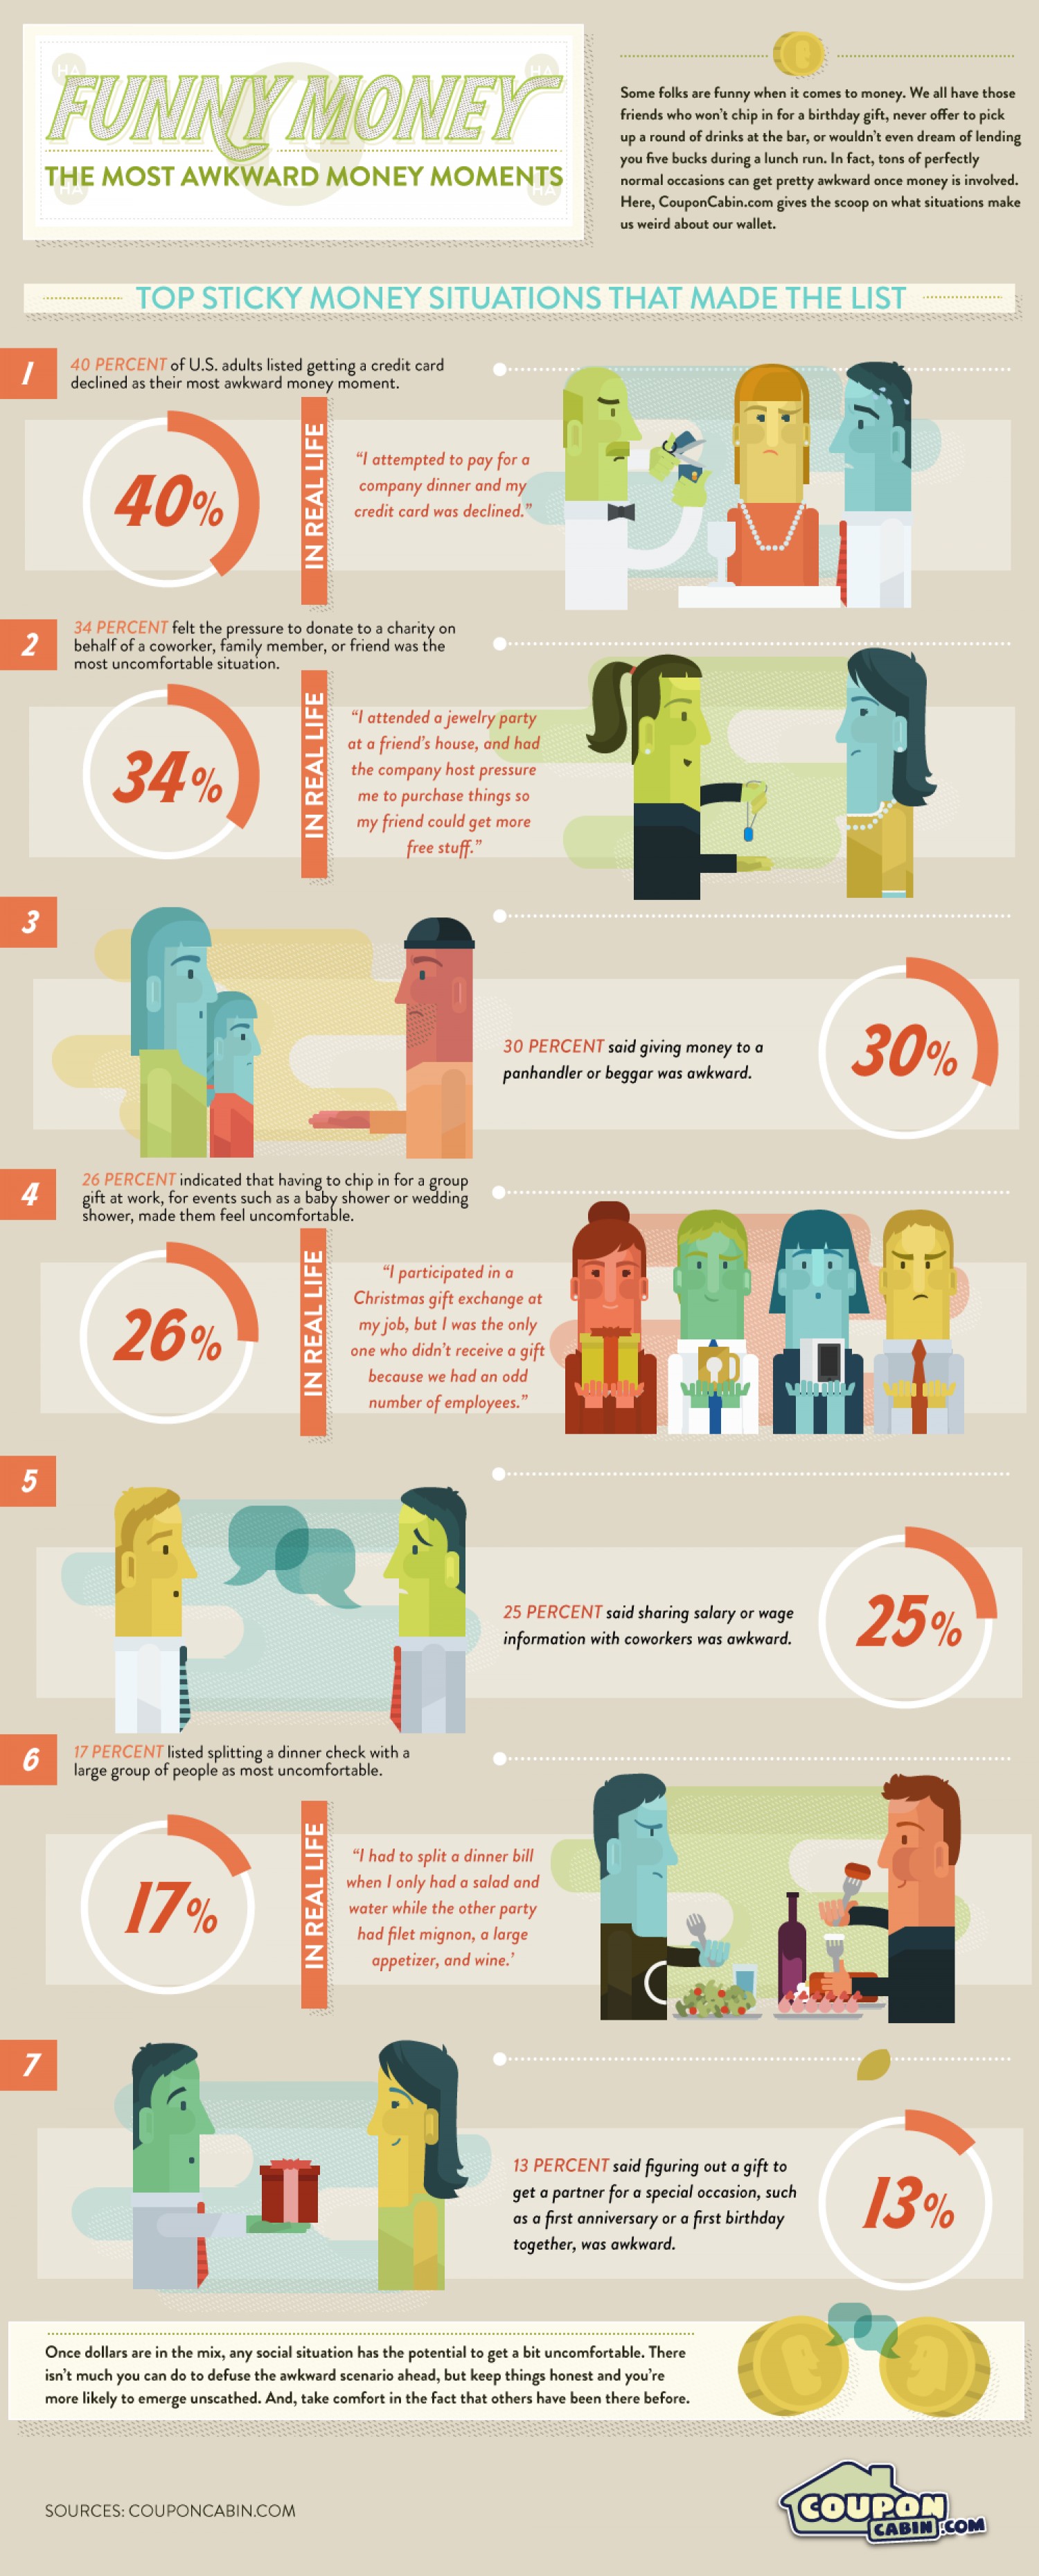
20. Funny Money
40% of US adults listed getting a credit card declined as their most awkward money moment while 34% felt the pressure to donating to charity on behalf of a relative or friend as the most uncomfortable money moment.
Source