Employment is a socially and politically picky issue and is responsible for defining the path that towns, cities and countries take when deciding the fate of their future generation of workers.
Employment environment defines where do the young women and men graduating out of academic institutions head to, in terms of making money and advancing their careers for the rest of their lives.
It is about out societies making sure that every man and women get the right job paying the right salary under the right working conditions.
1. Case For Pre-Employment Background Checks
A background check evaluates a candidate’s qualification, character and fitness and verifies accuracy of her claims. As per Jack Welch, the well-known earlier CEO of GE says that nothing is more important for an organization’s success than hiring the right people.

Source
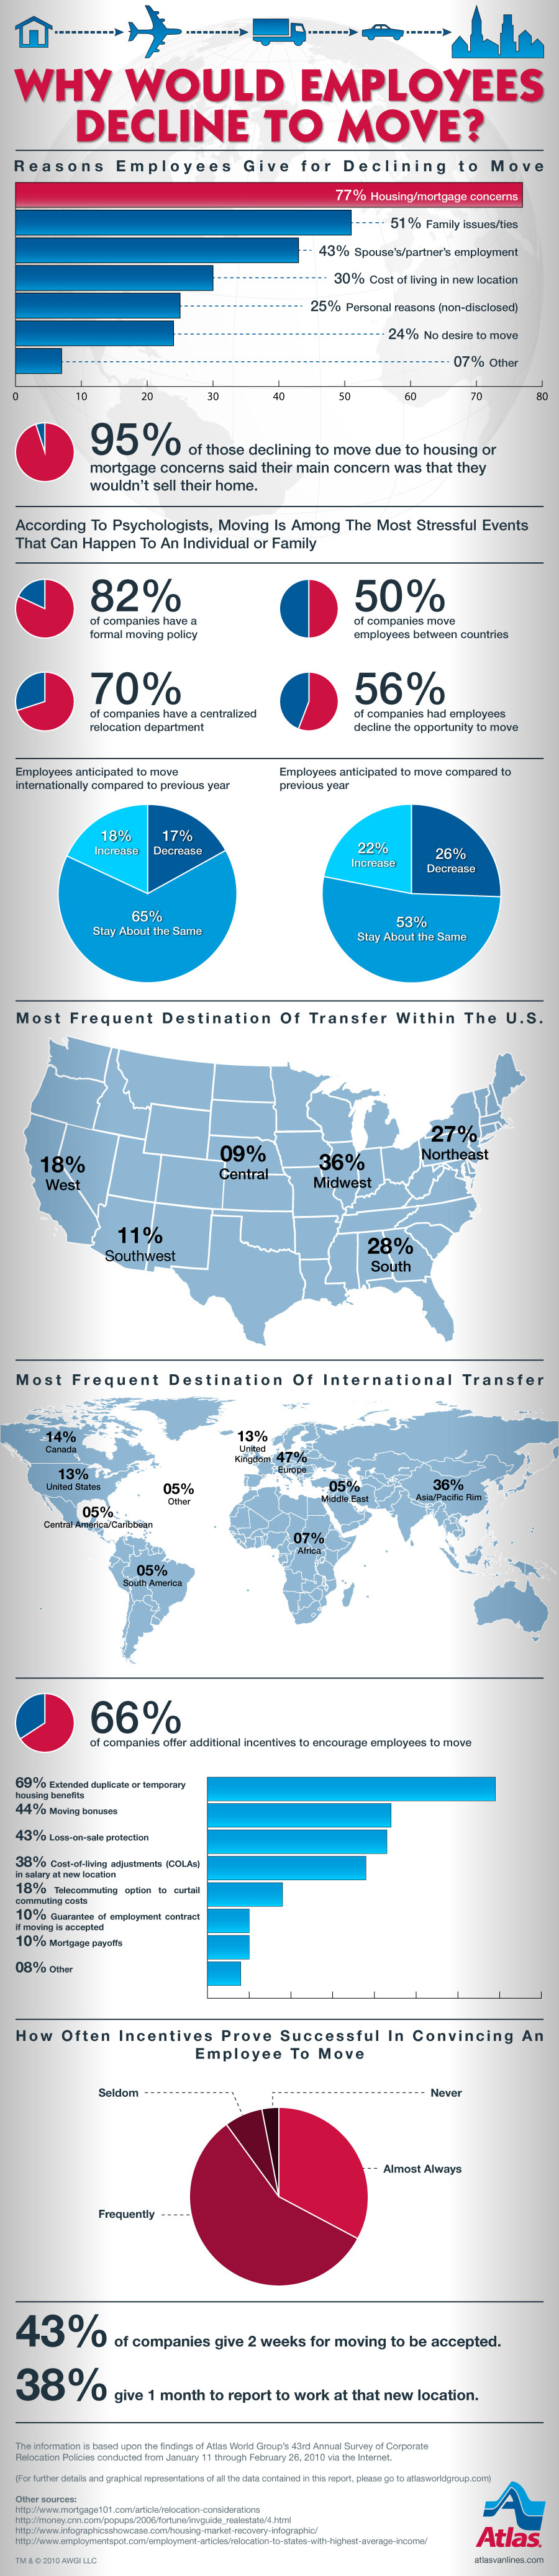
2. Why Employees Decline To Move
The greatest 77% of the employees state housing and mortgage related issues to be the reason for them not moving. Another 43% cite Spouse’s / Partner’s employment, 30% mention the higher costs of living in new location, 25% personal reasons, 24% say they do not desire to move and 7% give some reason not mentioned above.
Source
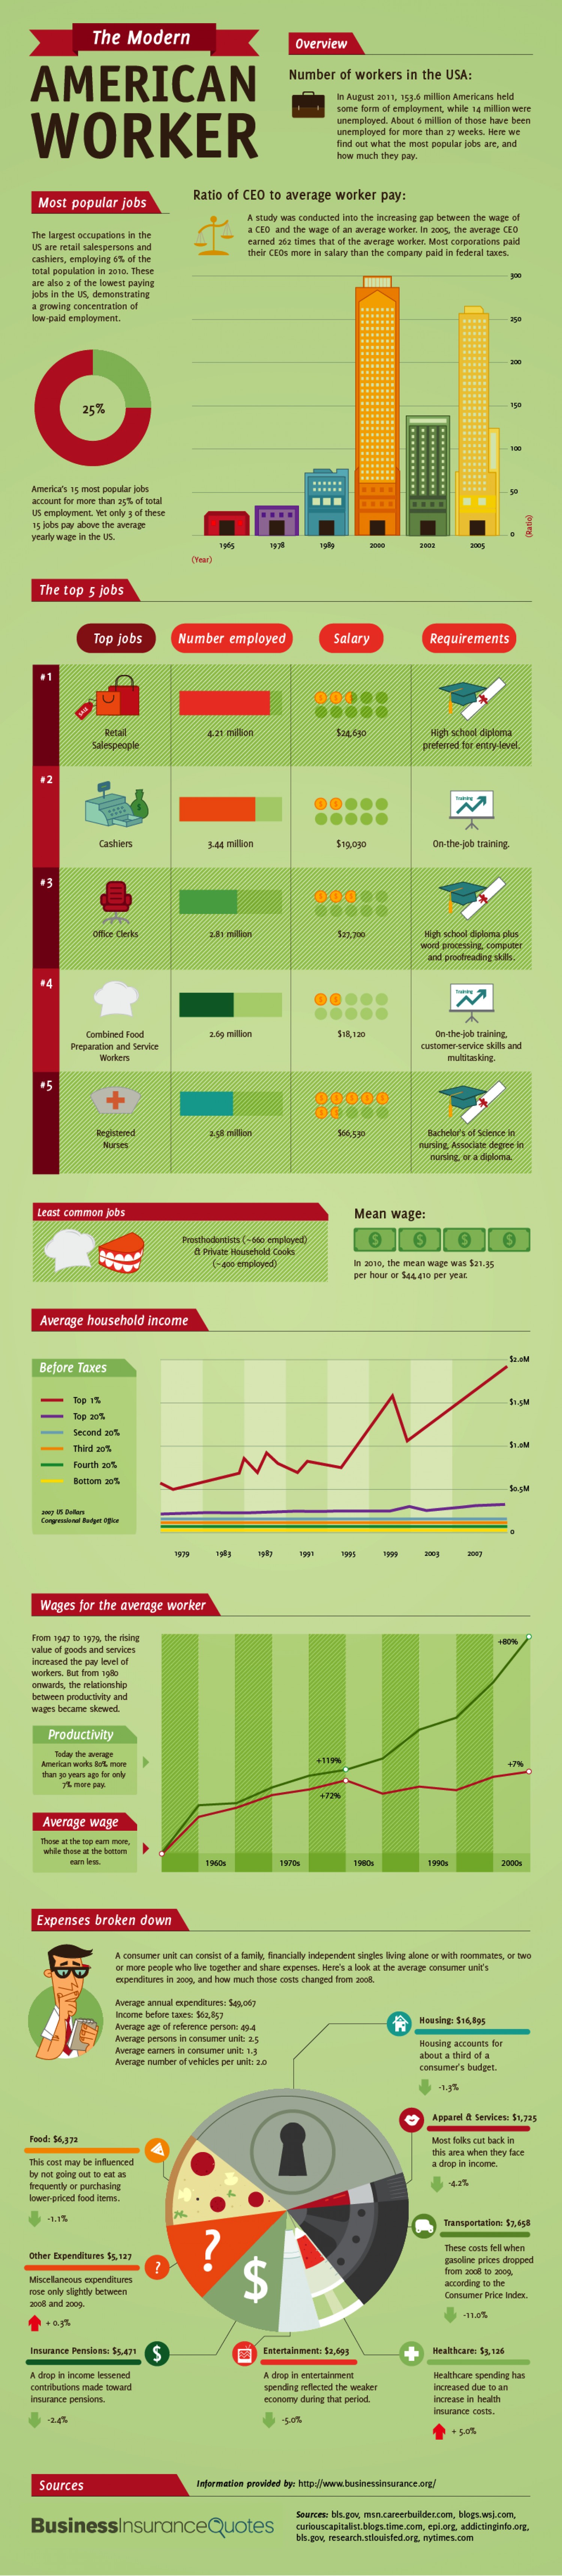
3. American Employment Wages And Expenses
In 2005, an average CEO in the US earned 262 times more than the average US worker did. The mean wage in 2010 was $21.35 per hour and the average wage gap between those at the top and the bottom increased from 47% to 73% between 1980s and 2000s.
Source
4. Green Jobs
These jobs produce goods and services that improve earth’s environment. An economy created from these jobs is called green, clean or low-carbon economy. Number of green jobs in the US grew from 750,000 in 2008 to 2.7 million in the year 2011.

Source
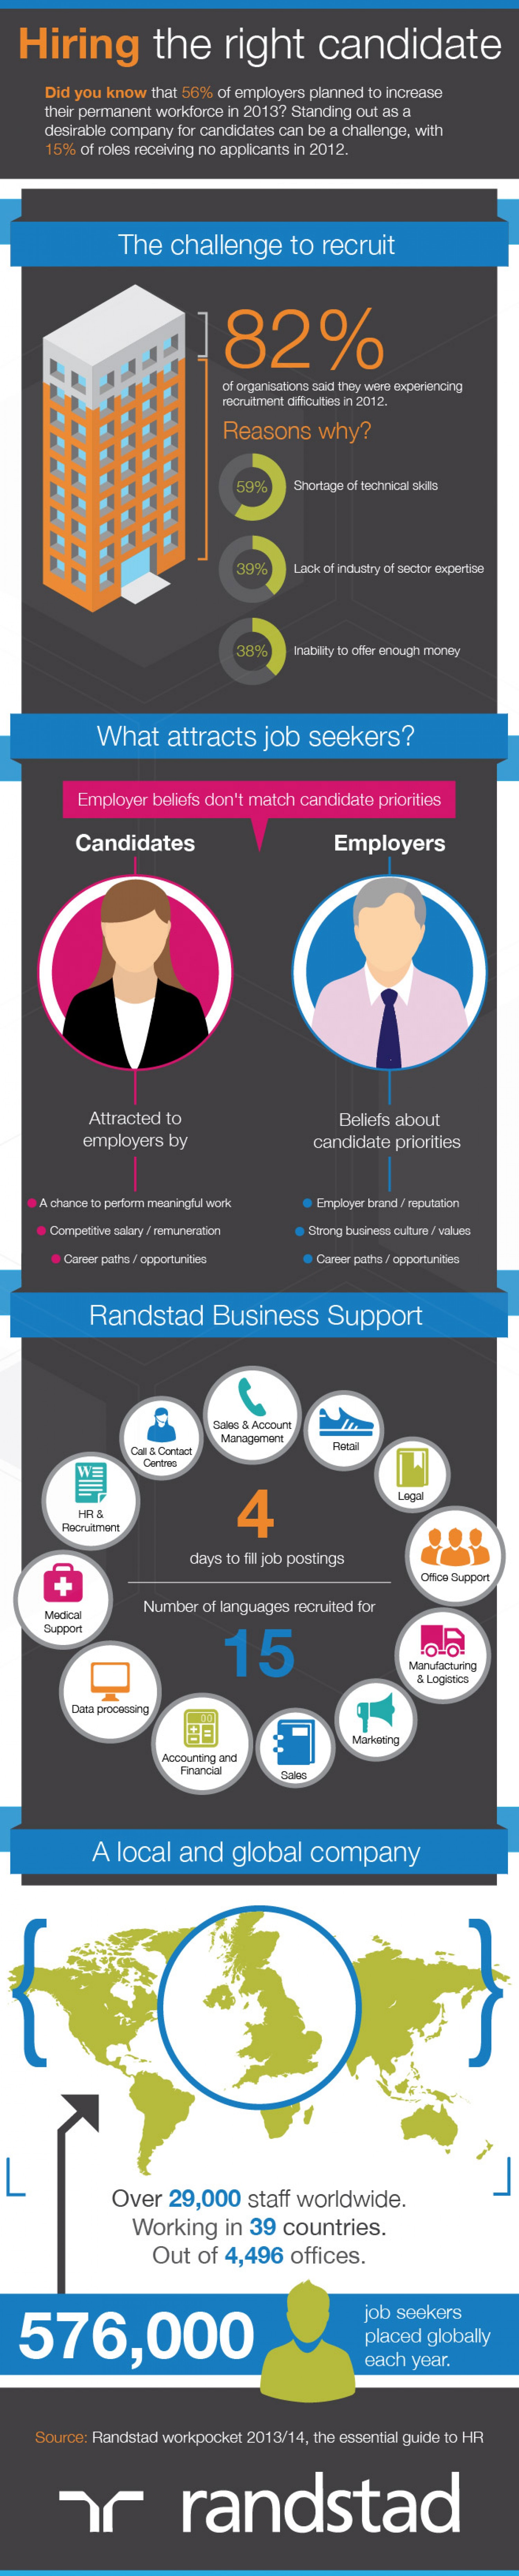
5. Hiring The Right Candidate
With more than 56% employers in 2013 planning to have more hires that are permanent, it will be difficult for employers to be the target by candidates since 15% of roles did not receive an application the past year. Almost 82% organizations said they felt problems in hiring in 2012, with 59% citing less availability of technical skills, 39% mentioning lack of industry sector expertise and 38% said they were unable to offer the money demanded for the job.
Source
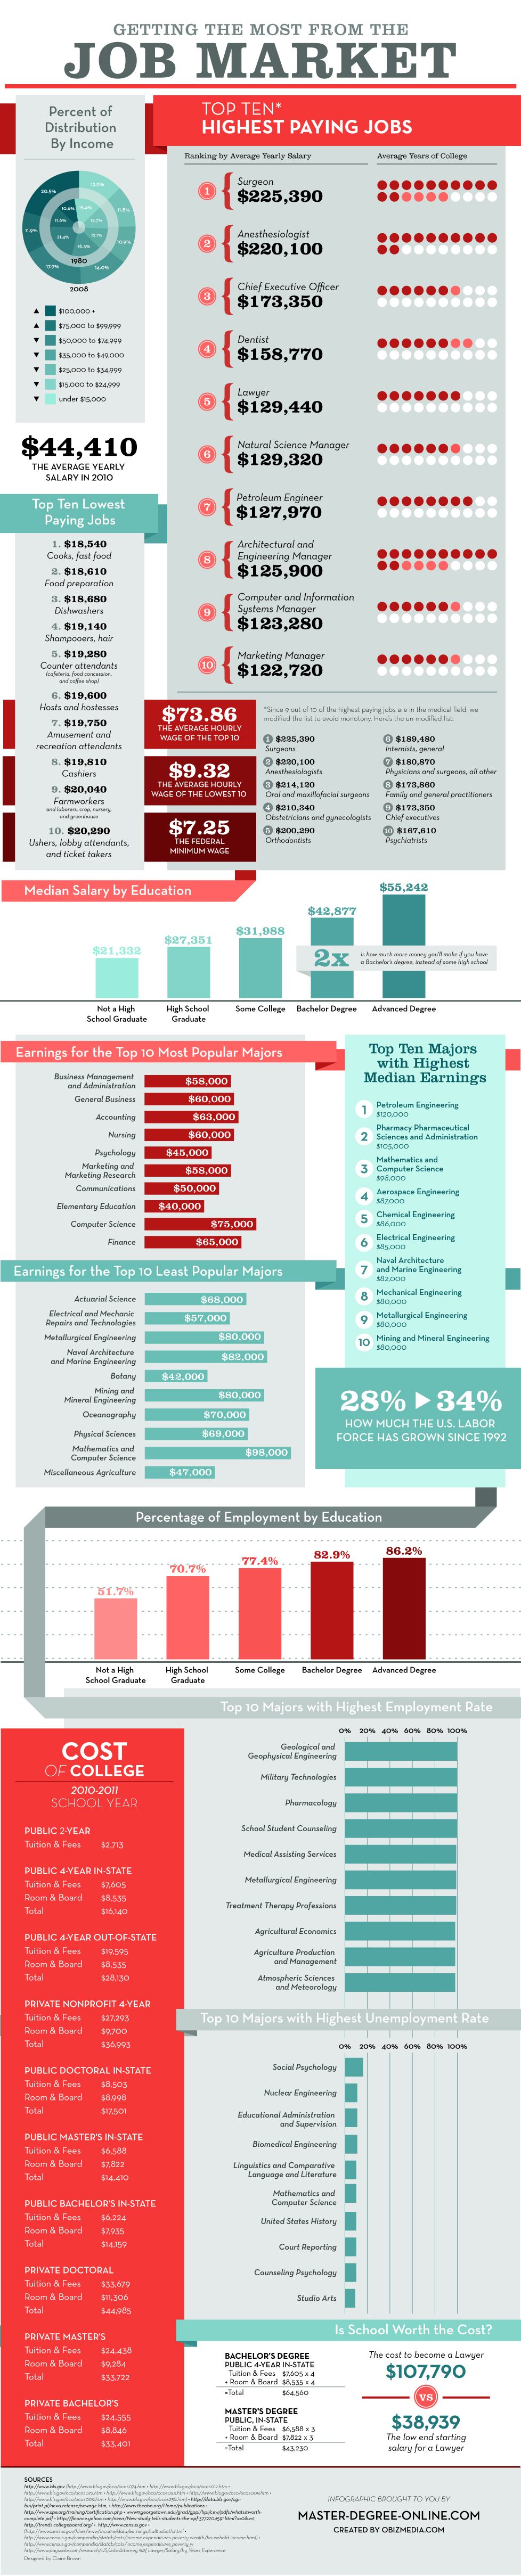
6. Getting The Most From The Job Market
With surgeons making the highest average yearly salary of $225,390 many of you would rue as to why you not become a surgeon. Maybe it was the number of years that you had to spend getting a degree or perhaps you just don’t like the sight of blood. The Marketing Managers and Computer Systems Managers are on the other end of the scale at $122,720.
Source
7. The State Of Jobs In The US
New Hampshire has the fourth lowest unemployment rate and ninth highest personal income per capita making it the most economically resilient state of the US. Connecticut has the highest per capita personal income in the country of $56,566.
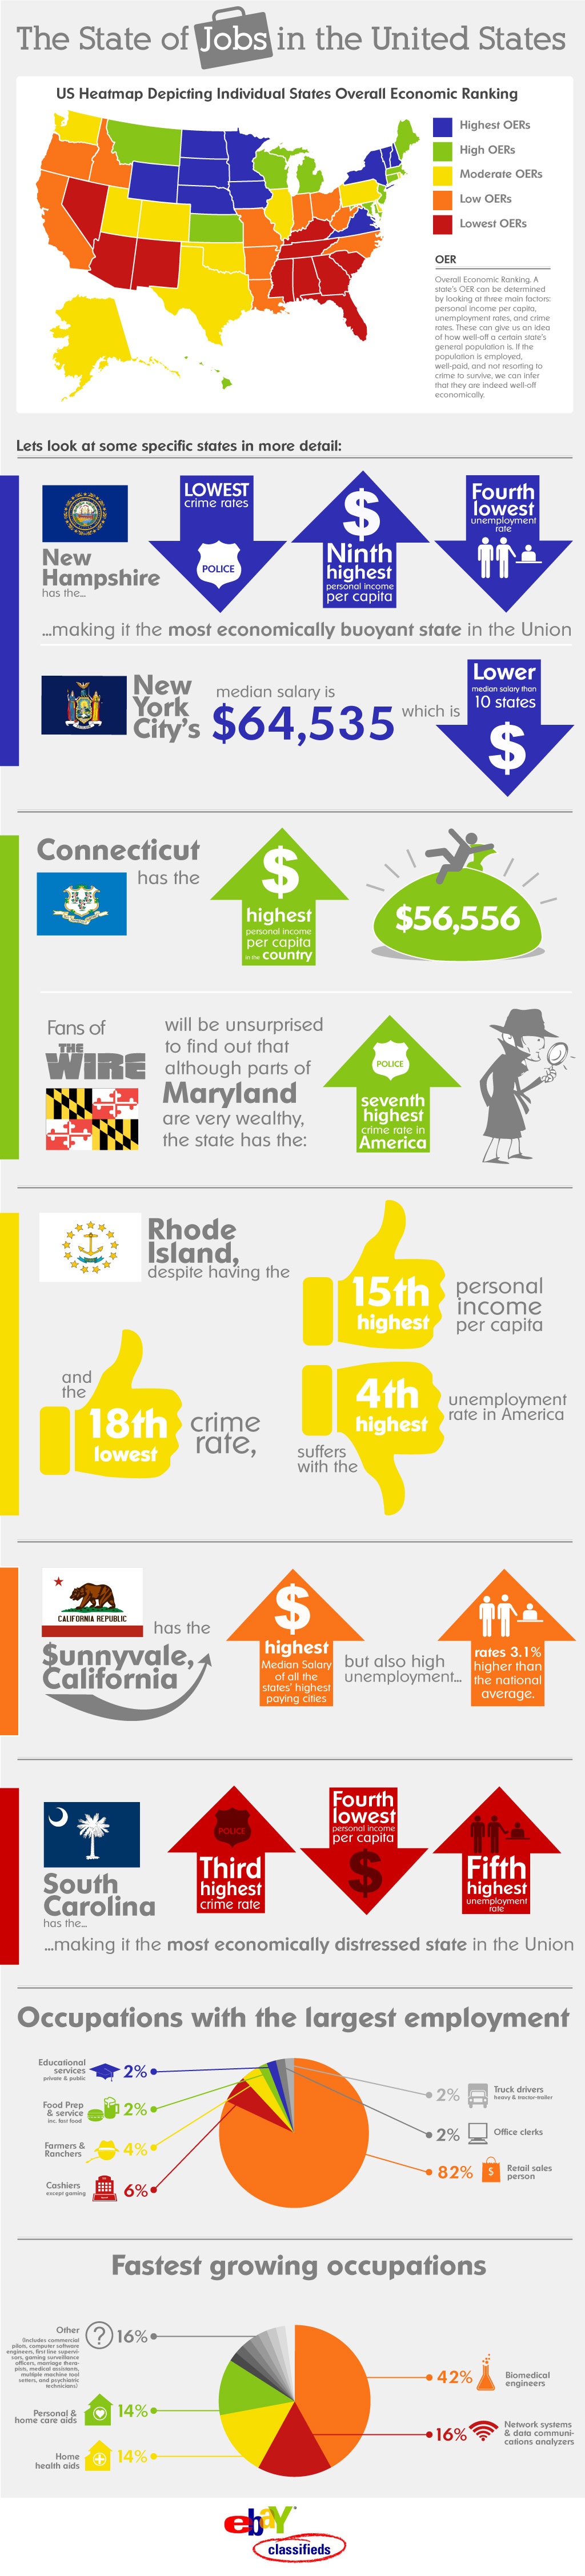
Source
8. Education vs Employment
A professional degree helps you earn the highest lifetime income and unemployment rate for professional degree holders is also the second lowest. Petroleum Engineering is the top paying college degree while Social Work degree is the worst paying.
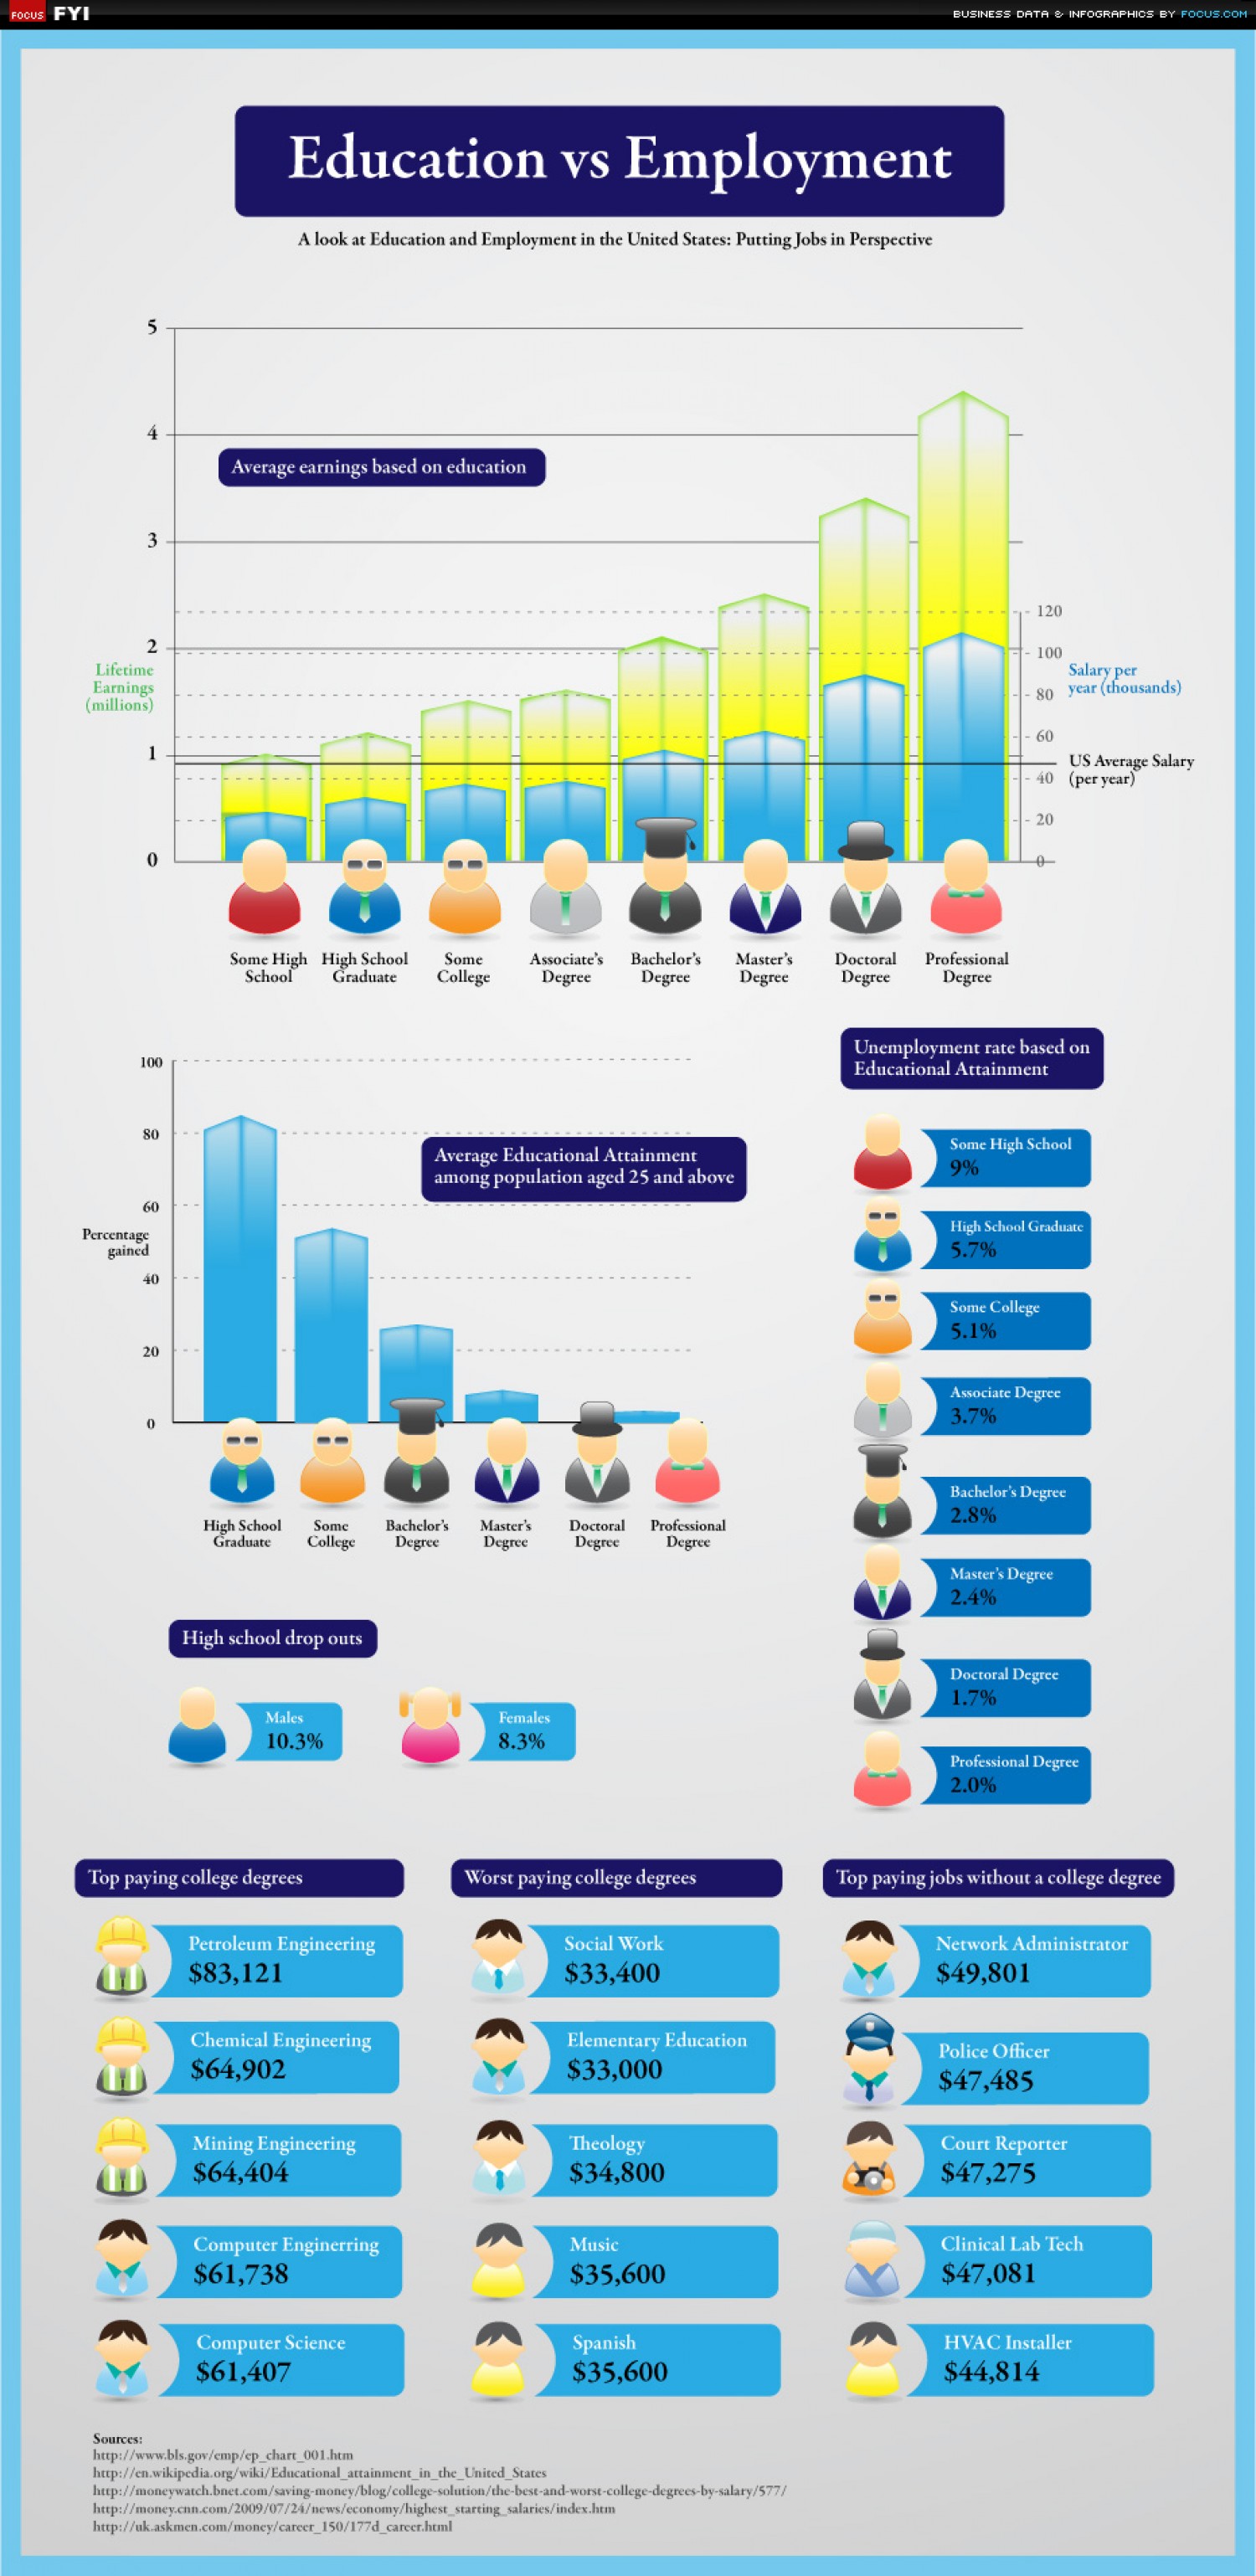
Source
9. Employment Statistics For Language Jobs
In the UK, London has the highest requirement for language speakers while West Midlands has the least with English having the highest demand and Flemish the lowest. Customer Service and Call Center jobs employ the highest number of language workers while Telecommunication employs the lowest.
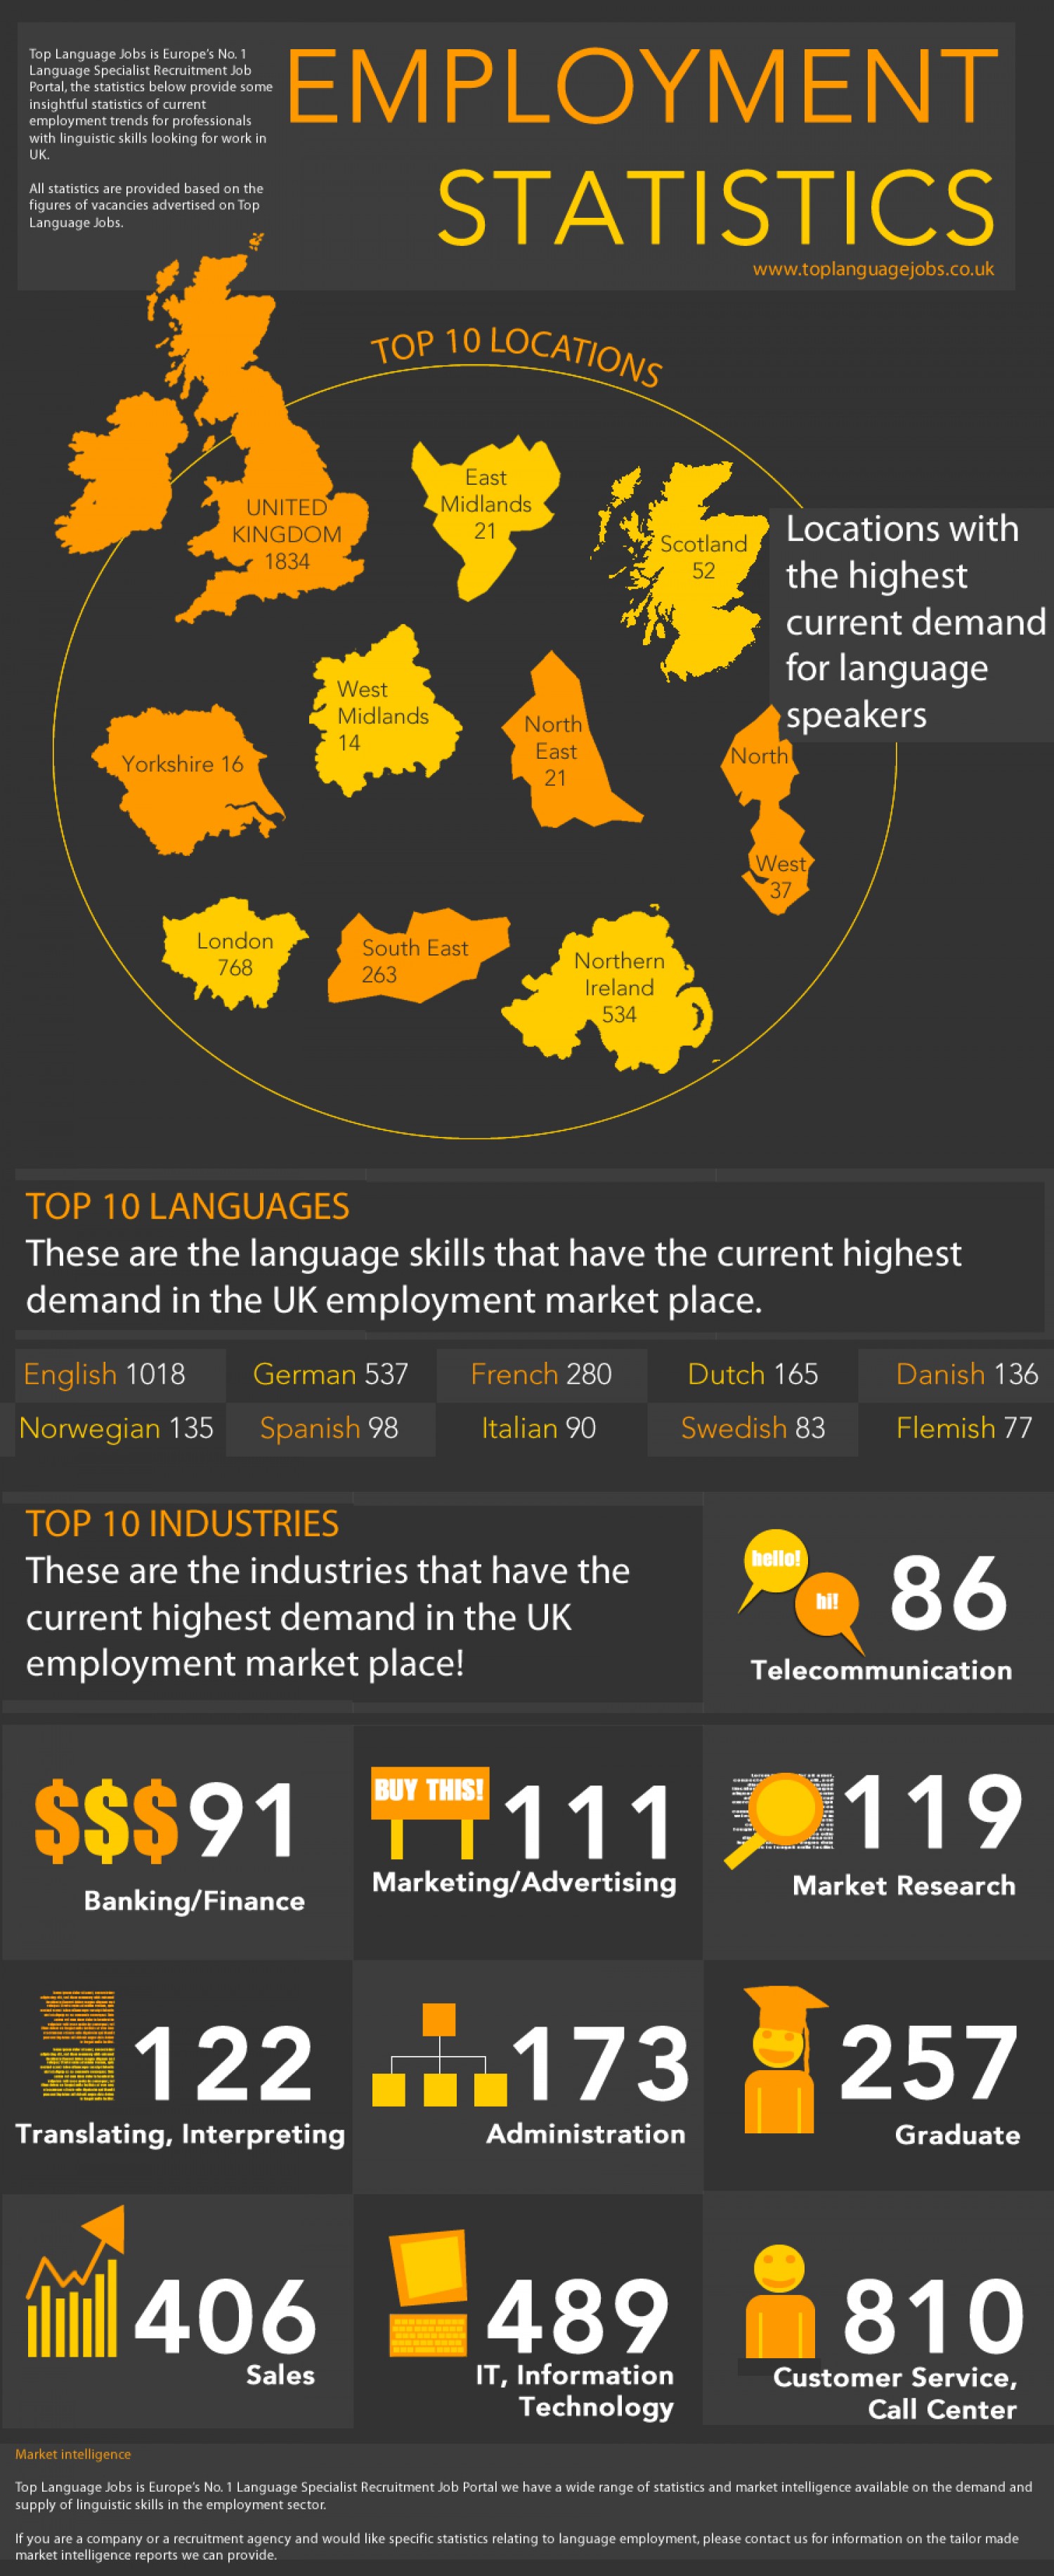
Source
10. National Employment Report
As per ADP National Employment Report published in Aug 2013, the medium-sized non-farm private business sector saw the highest positive change in job rate while the large sector saw the least. Amongst goods producing sectors, manufacturing was better than construction.
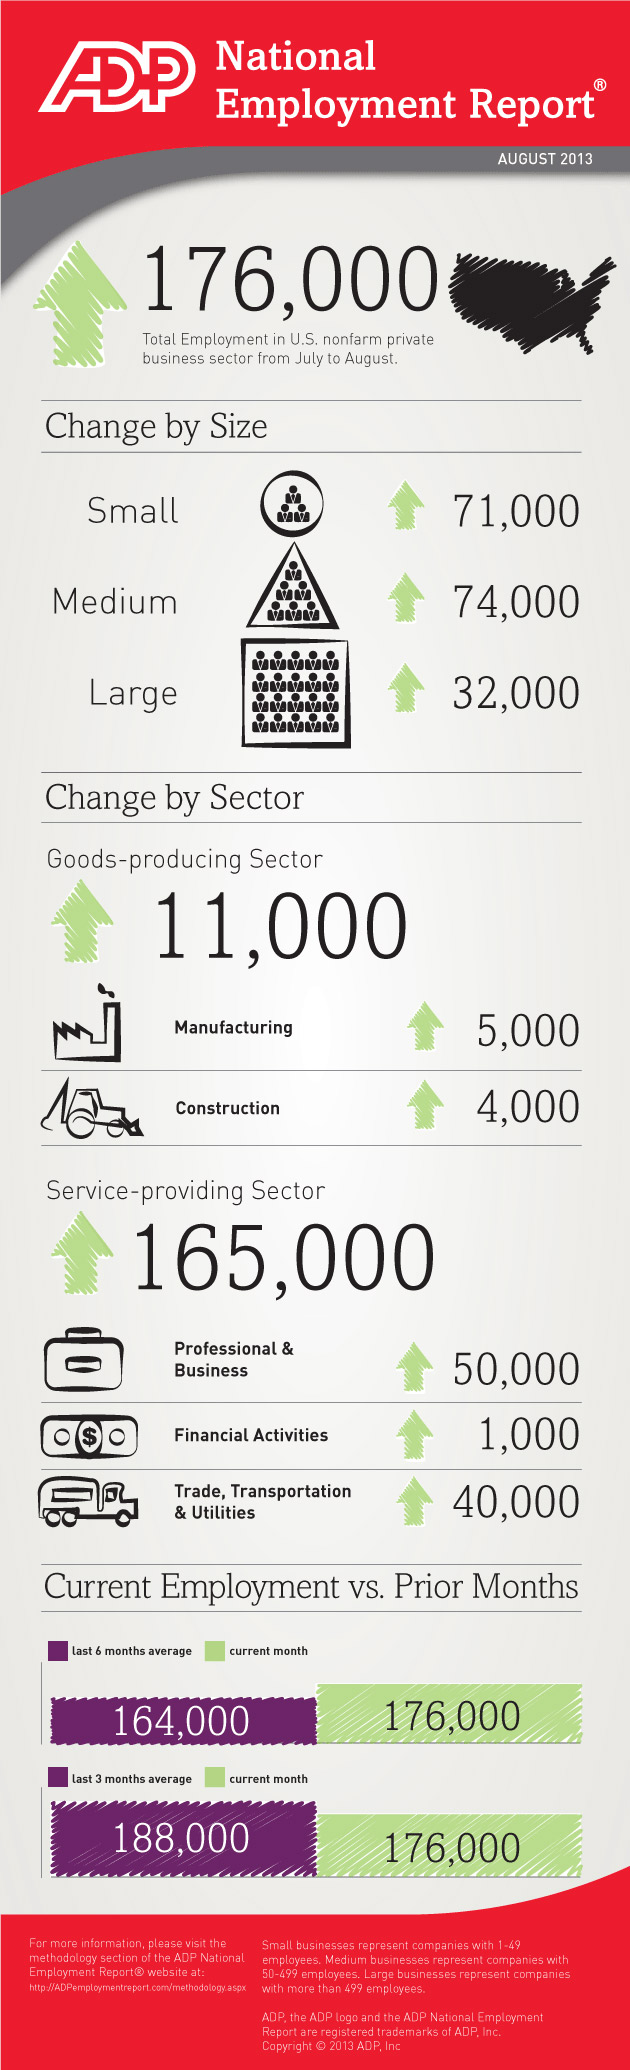
Source
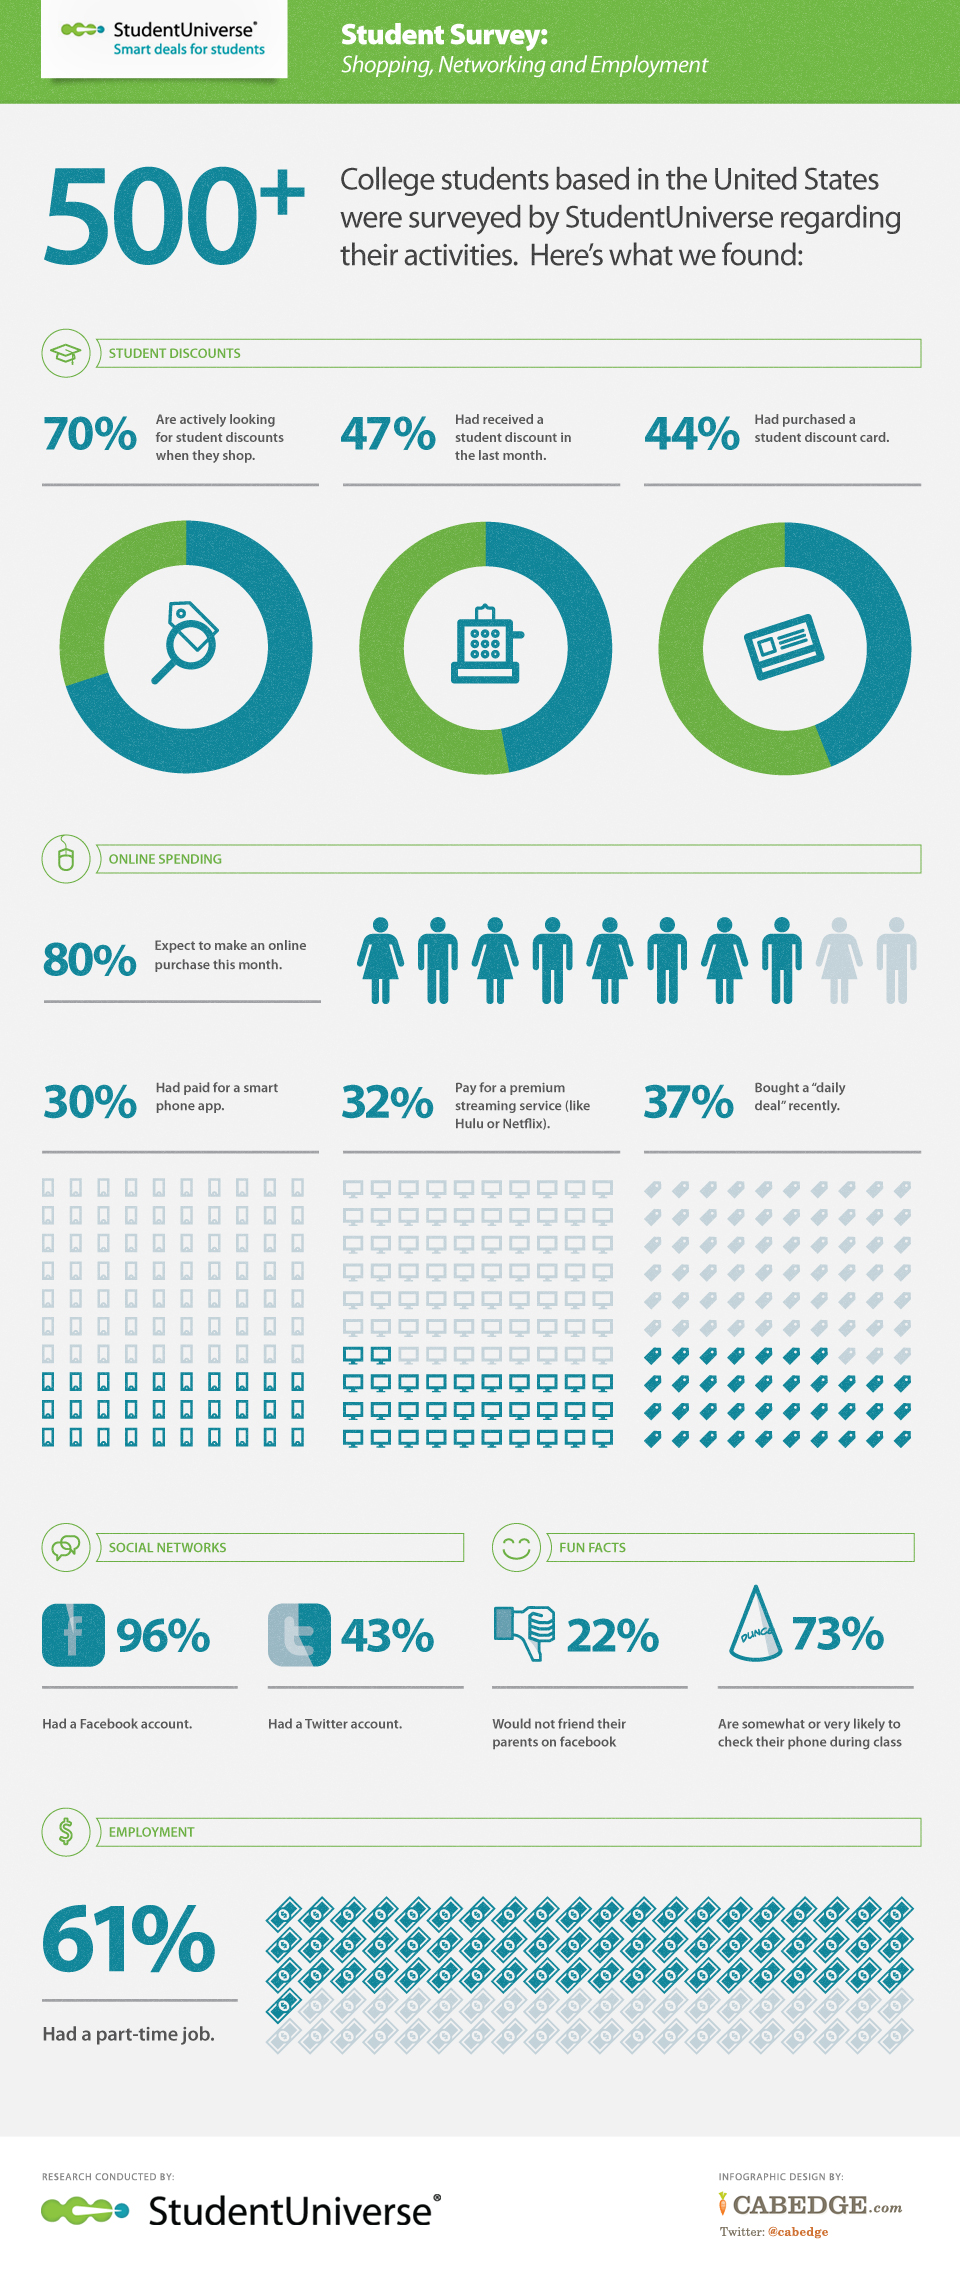
11. Student Survey: Shopping, Networking And Employment
Of more than 500 US college students surveyed, 70% mentioned they were looking for student discounts when shopping, 47% said to have received a student discount during last month and 44% bought a student discount card.
Source
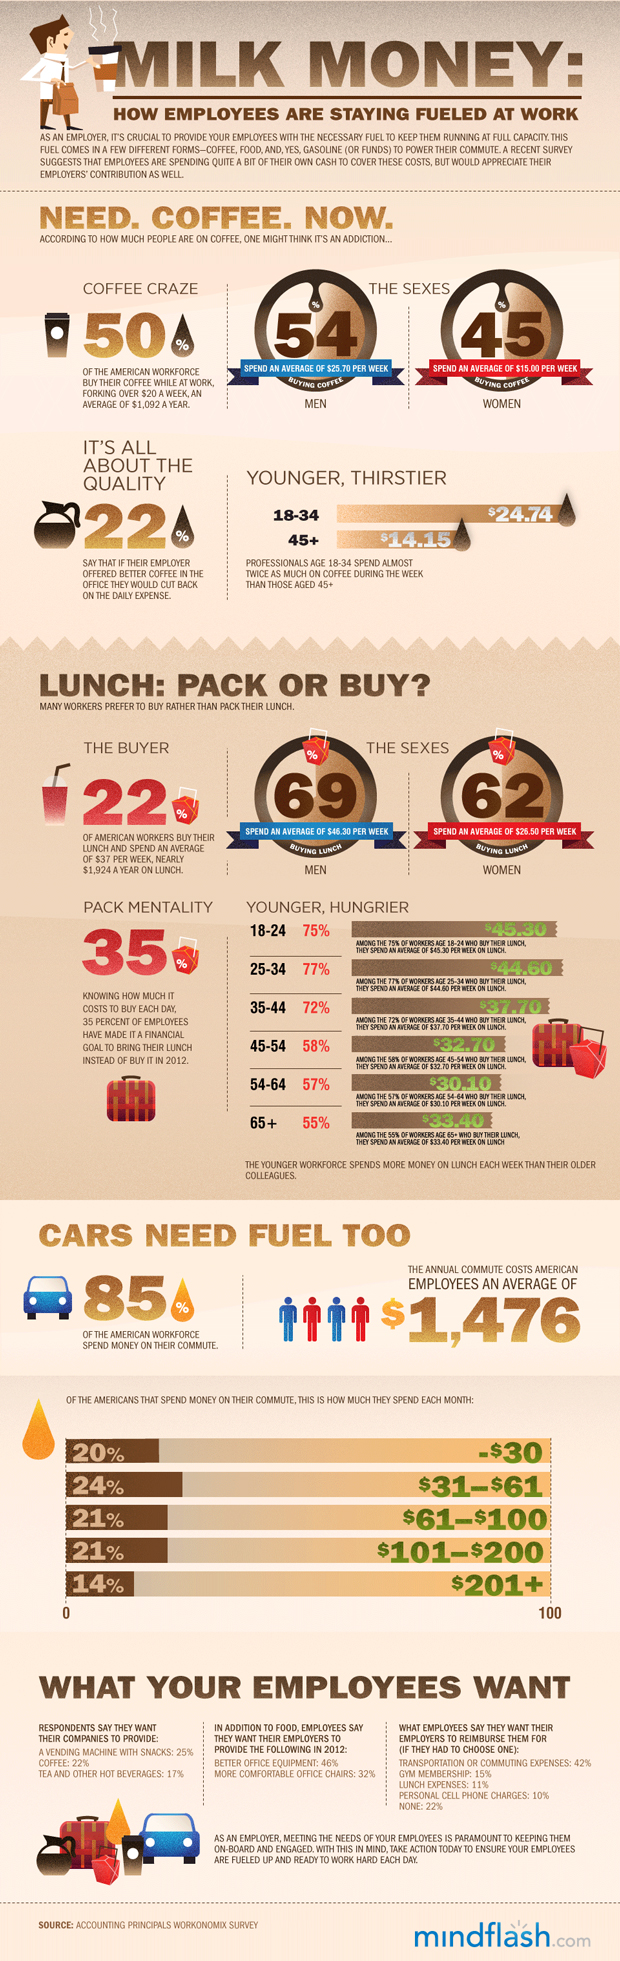
12. How Employees Are Staying Fueled At Work
50% of American employees buy their coffee at work, shelling out more than $20 per week. Between the sexes, while 54% men on an average spend $25.7 per week, for women it is $15. Also age-wise, people in age group of 18 to 34 spend $24.74 on an average per week while those in the 45 and above bracket spend $14.15.
Source
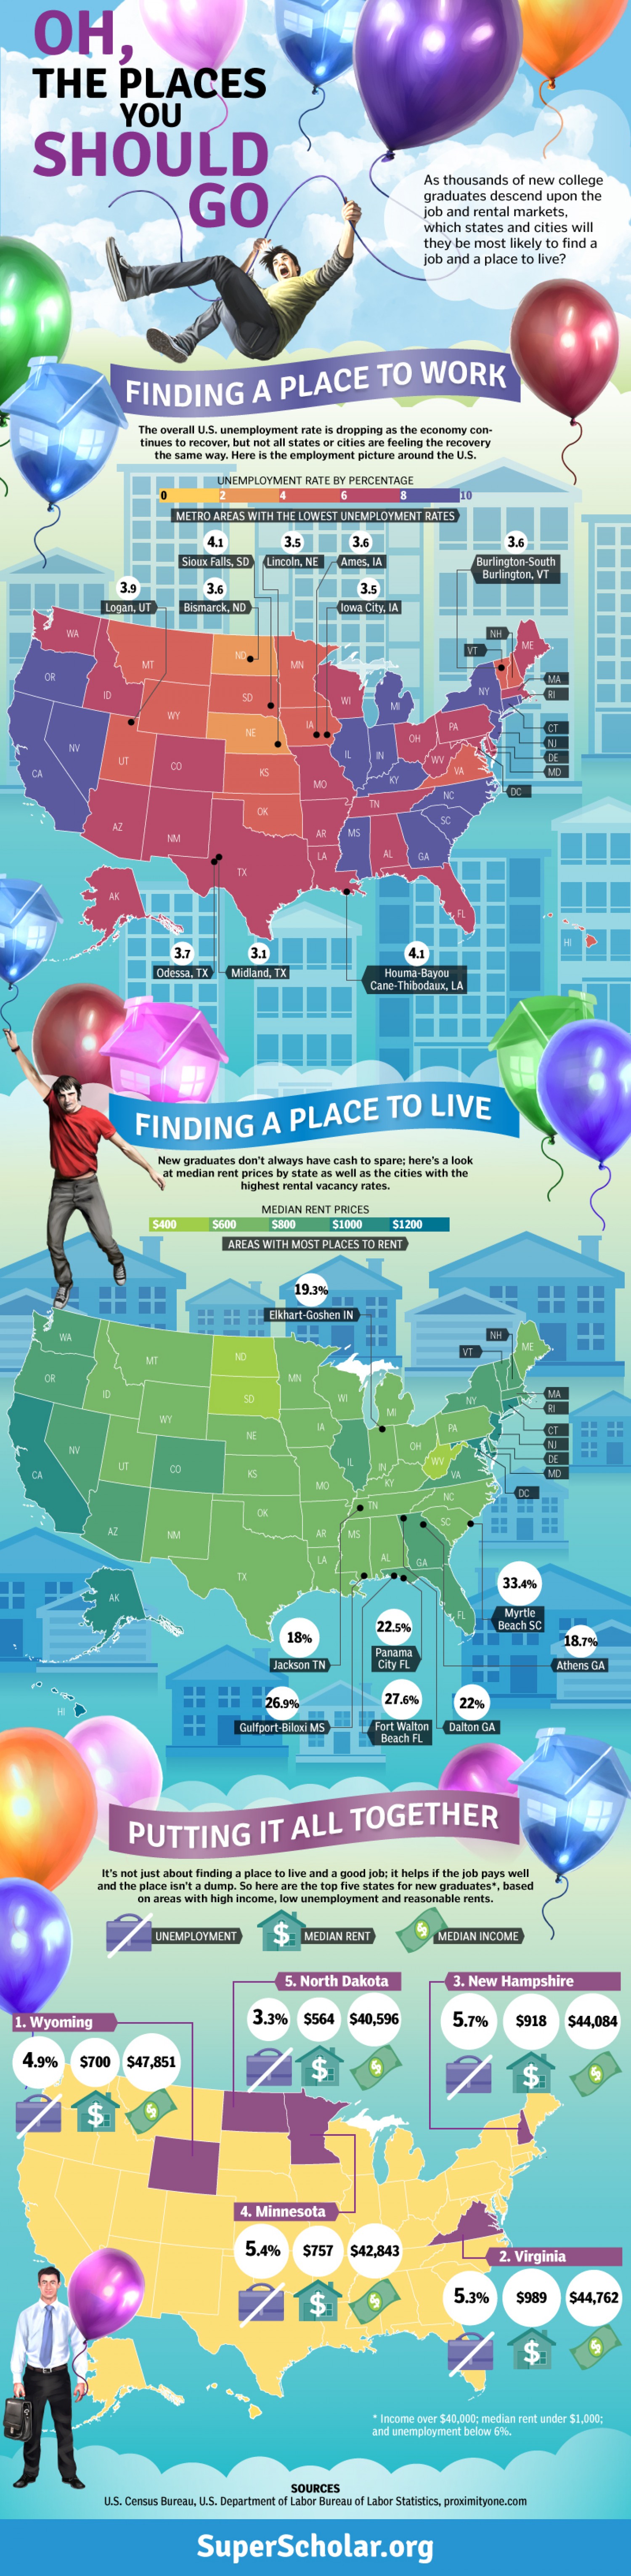
13. Oh, The Places You Should Go
Though the employment rate overall has been on the rise in US, there are several cities and states that are not seeing the recovery in the same way. The unemployment rate has been the least (3.1%) in Midland, TX and the highest (4.1%) in Sioux Falls, SD and Houma-Bayou Cane-Thibodaux, LA.
Source
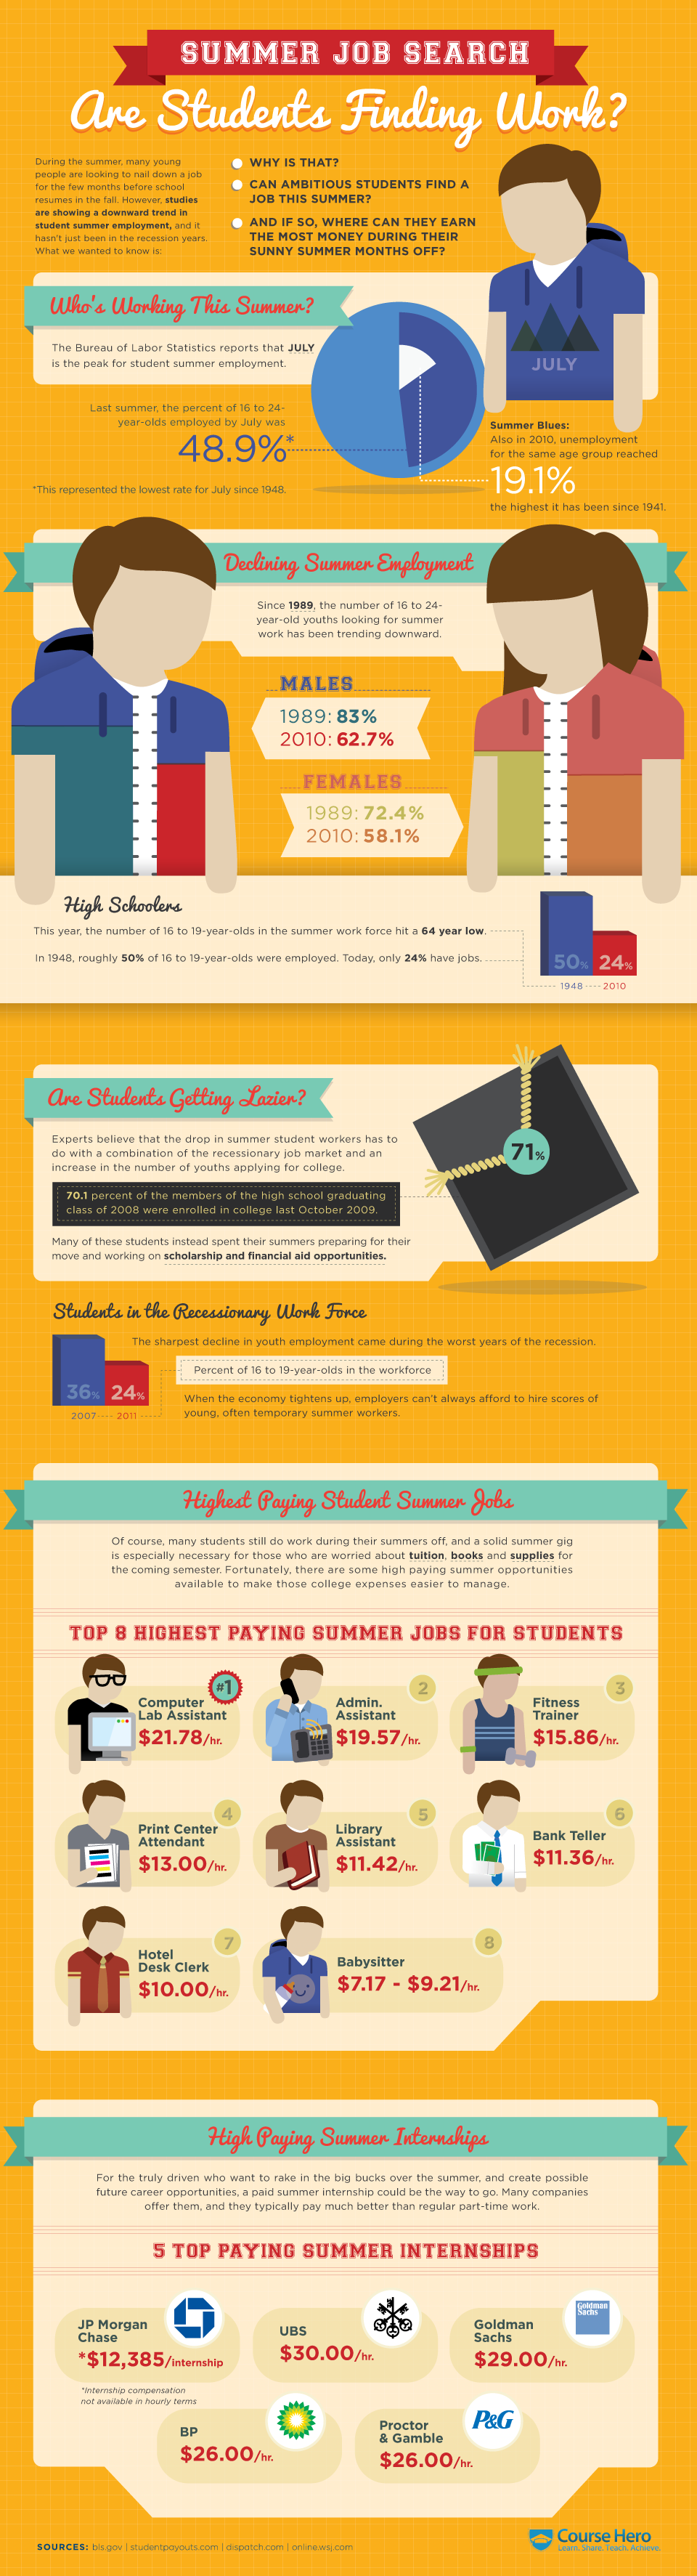
14. The Summer Job Search
July peaks as the month that sees highest summer unemployment for students and the 1989 to 2010 saw the number of males looking for work reducing from 83% to 62.7% and for females, it was 72.4% to 58.1%.
Source
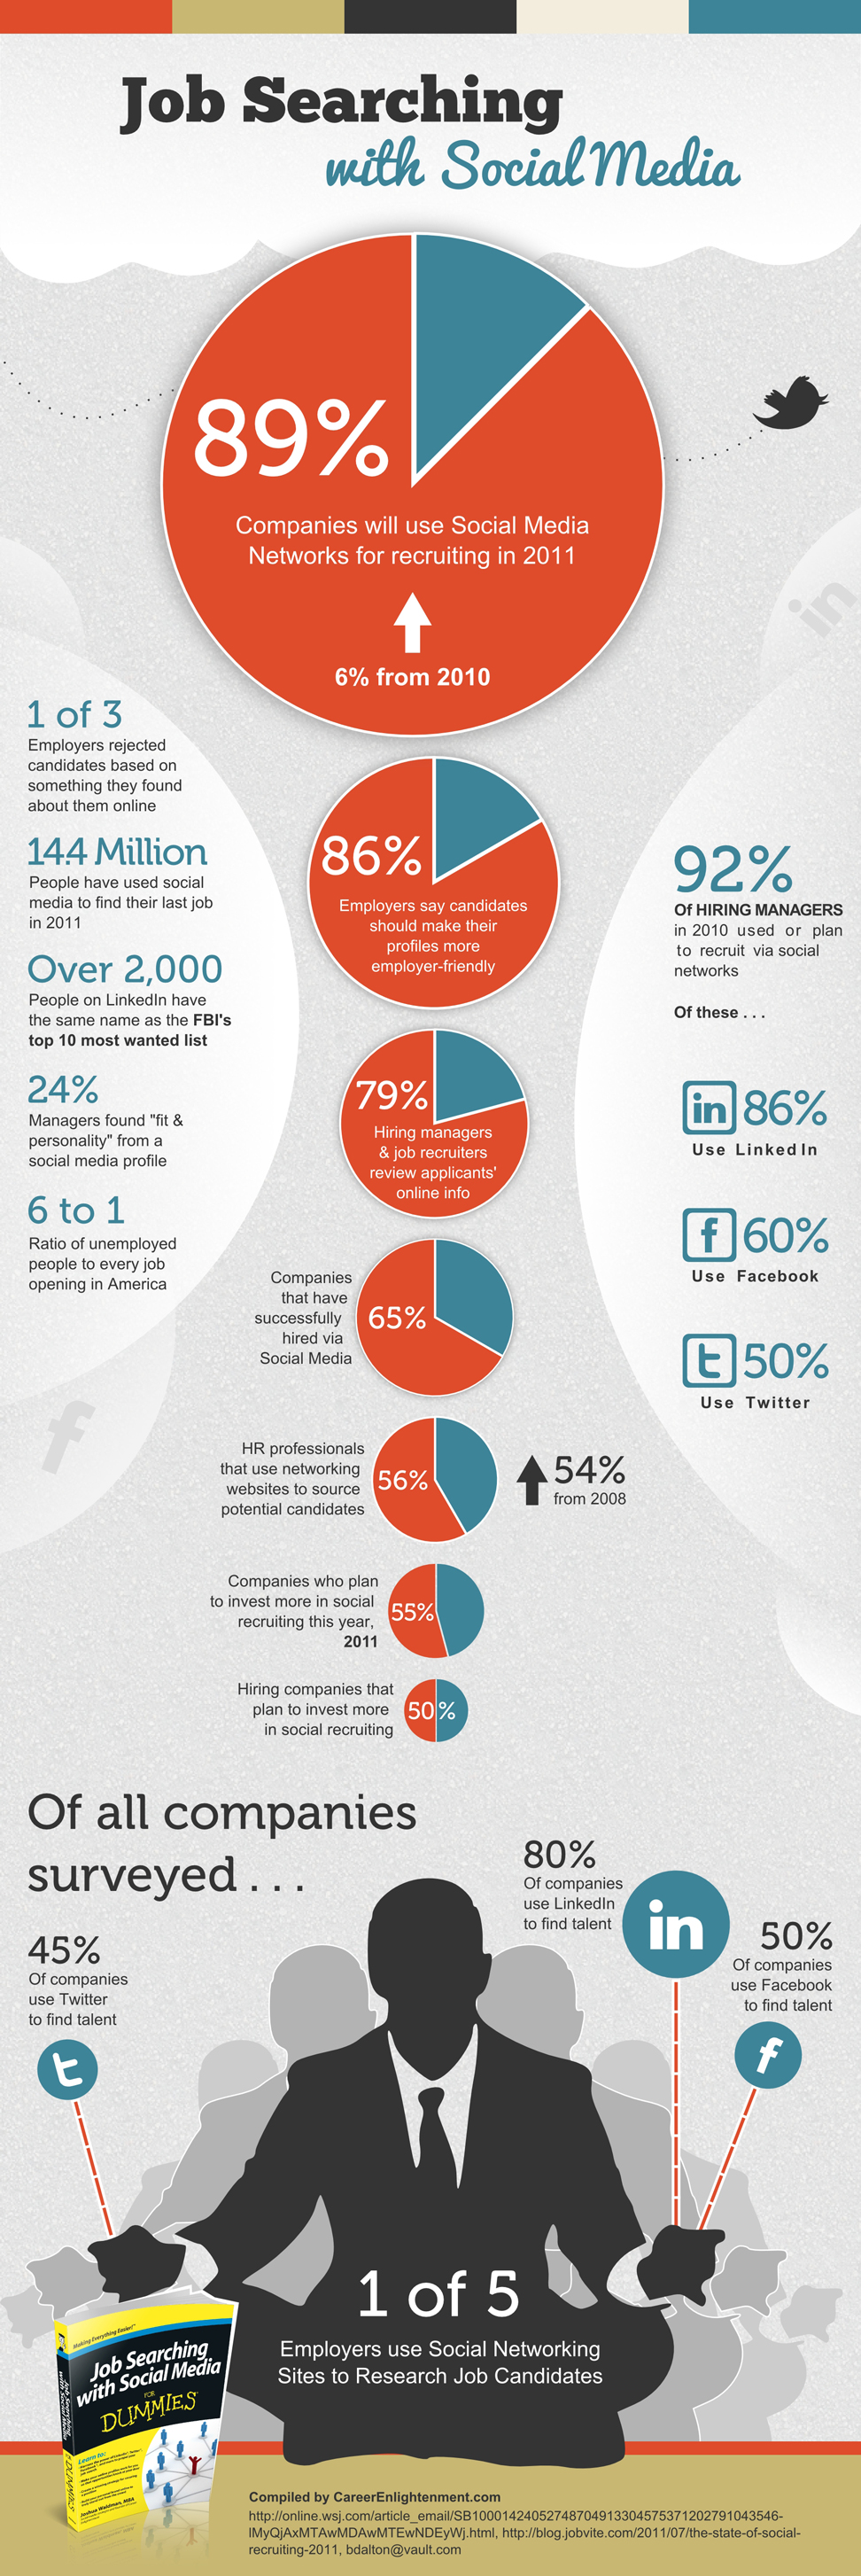
15. Job Searching With Social Media
Almost 89% of Companies were going to use social media as an essential tool for hiring in 2011. In addition, 92% of human resource recruitment managers were supposed to use social networks – of which 86% were to use LinkedIn, 60% Facebook and 50% Twitter.
Source
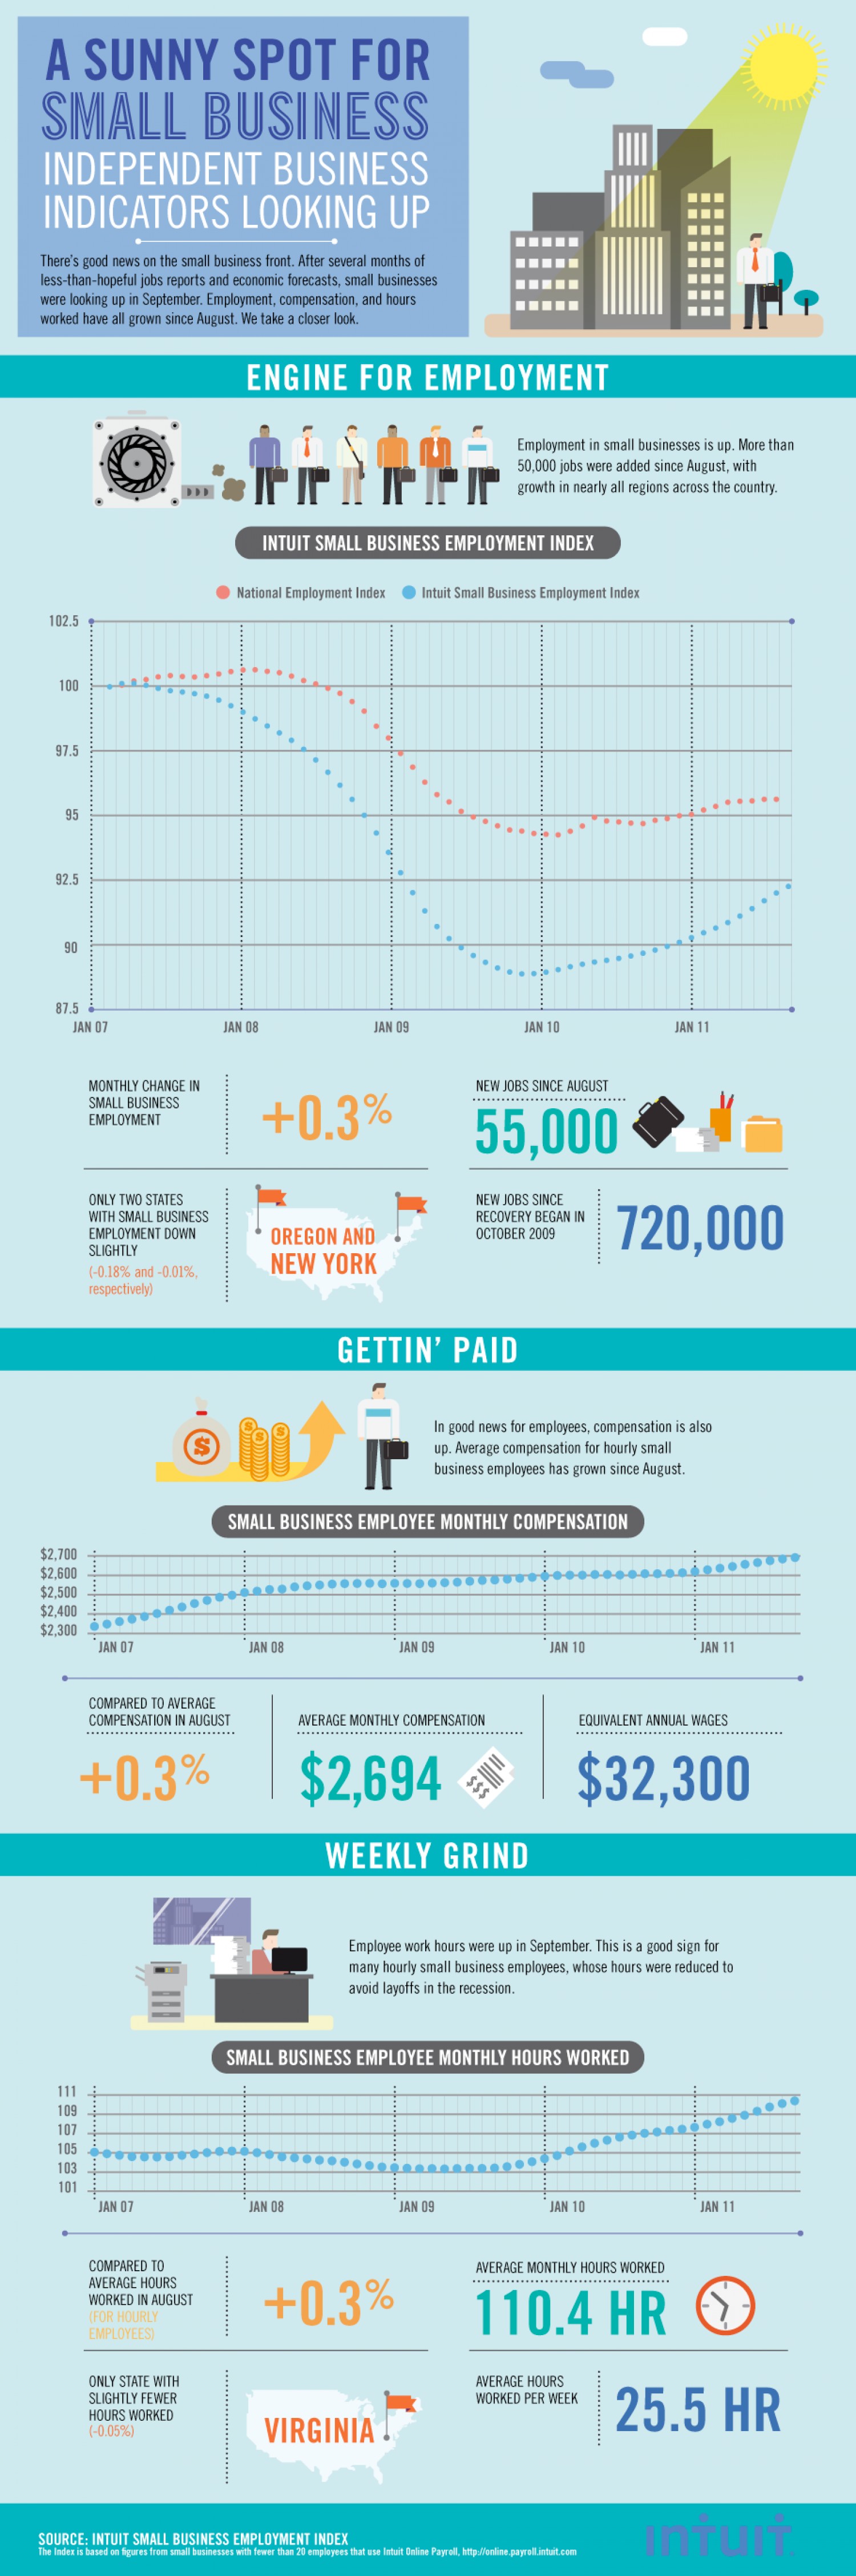
16. Small Business - Engine For Employment
More than 50000 jobs were added in the small business employment market in 2011 with the numbers growing across all regions in the US. The Intuit small business employment index followed the national employment index pattern for four years between Jan 2007 to 2011.
Source
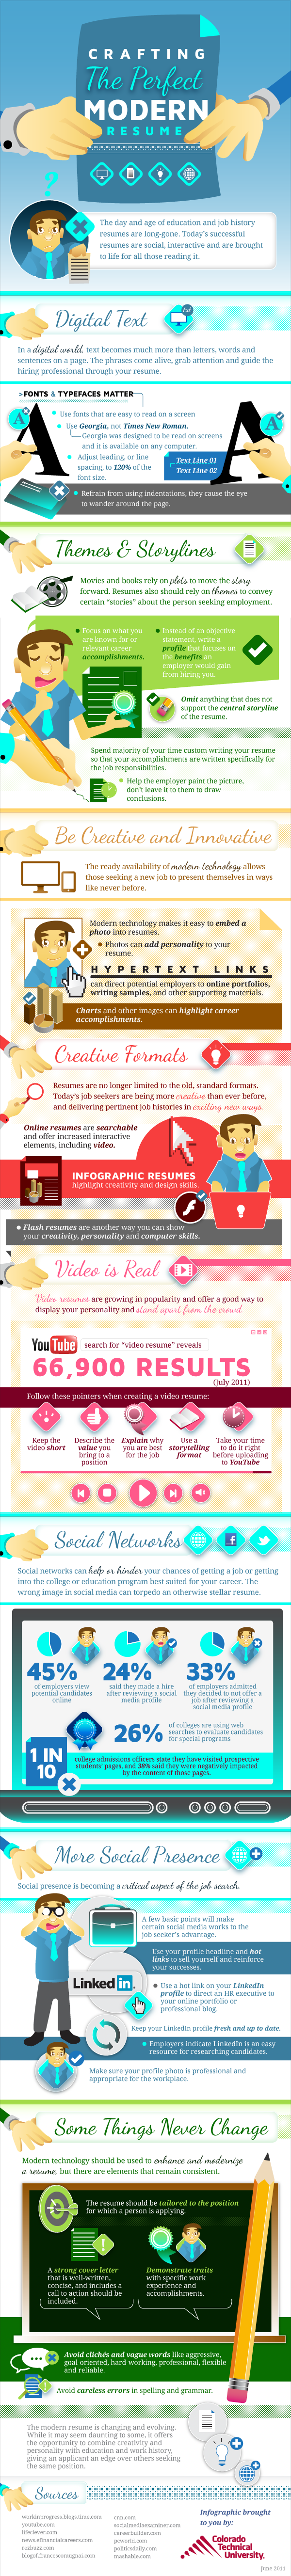
17. How To Spruce Up A Boring Resume
Education and Job history resumes are old fodder now, and socially interactive resumes are the in-thing. Using Georgia font and adjusting line spacing to 120% of font size makes for comfortable reading. A profile mentioning benefits presented to the employer by candidate are more effective than a plain simple objective statement.
Source
18. Getting A Job – Most Popular Lies Revealed
In Canada, 19% candidates painted a rosy picture of previous responsibilities to get a job, while the US saw 43% of candidates fudging their resumes. Amount of salary earned was the top lie while falsifying credentials for the profile was at the bottom.
Source
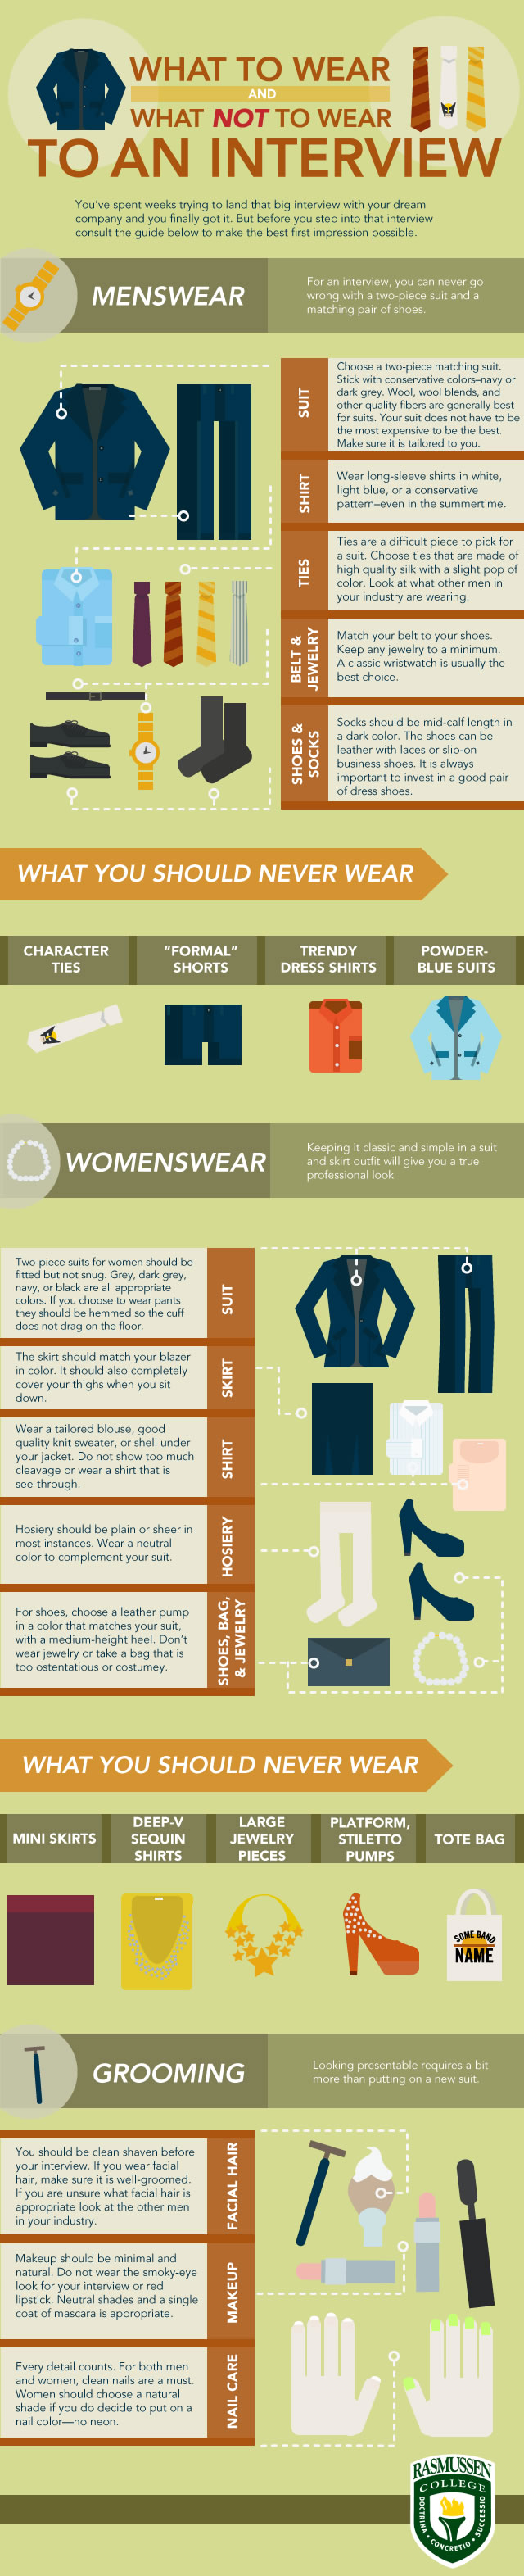
19. How To Dress For An Interview
For men, it’s always ok to go for an interview in a two-piece suit and a pair of matching shoes. Character Ties, “Formal” Shorts, Trendy Dress Shirts and Powder-Blue Suits are a strict no-no. For women, a simple suit and skirt outfit gives you those brownie points for a professional look.
Source
20. Employment Tax
Source