Submit Infographics

Home  »  Economy Graphs • Health Graphs • Static   »   Drinking Water Statistics/Graph

Drinking Water Statistics/Graph

drinking water statistics


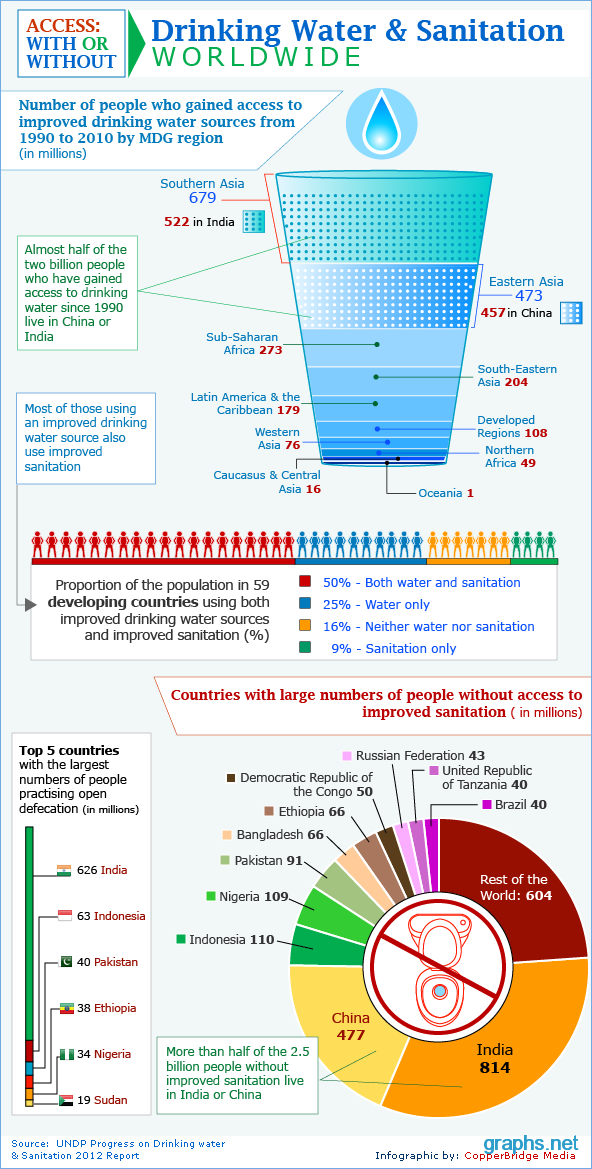
Even after advancements in the technology and still in this fast paced world, there are few countries that lack of pure water for drinking. As per the UNDP Progress of Drinking Water & Sanitation 2012 Report has revealed that nearly 2 billion people have gained access to drinking water and all the people are from India and China.

The report even depicted that people utilizing improved drinking water were capable to access good sanitation. India with 626 million people leads the list of popular countries that started implementing open defecation and the next on list is Indonesia with 63 million people.

Categories : Economy Graphs, Health Graphs | Published by : graphs | Date : Jul 6, 2012
Tags: drinking water facts and figures, drinking water facts canada, drinking water facts health, drinking water statistics united states, state drinking water information system

Credits

Source : http://www.who.int/en/
Add missing credits


Related Posts

Aging Youthfully
Few Important Suggestions to Follow While Renovating a House – Infographic


Copyright 2023 Graphs.net
i i i
  • Contact
  • Terms of Use
  • Privacy Policy
Scroll Up