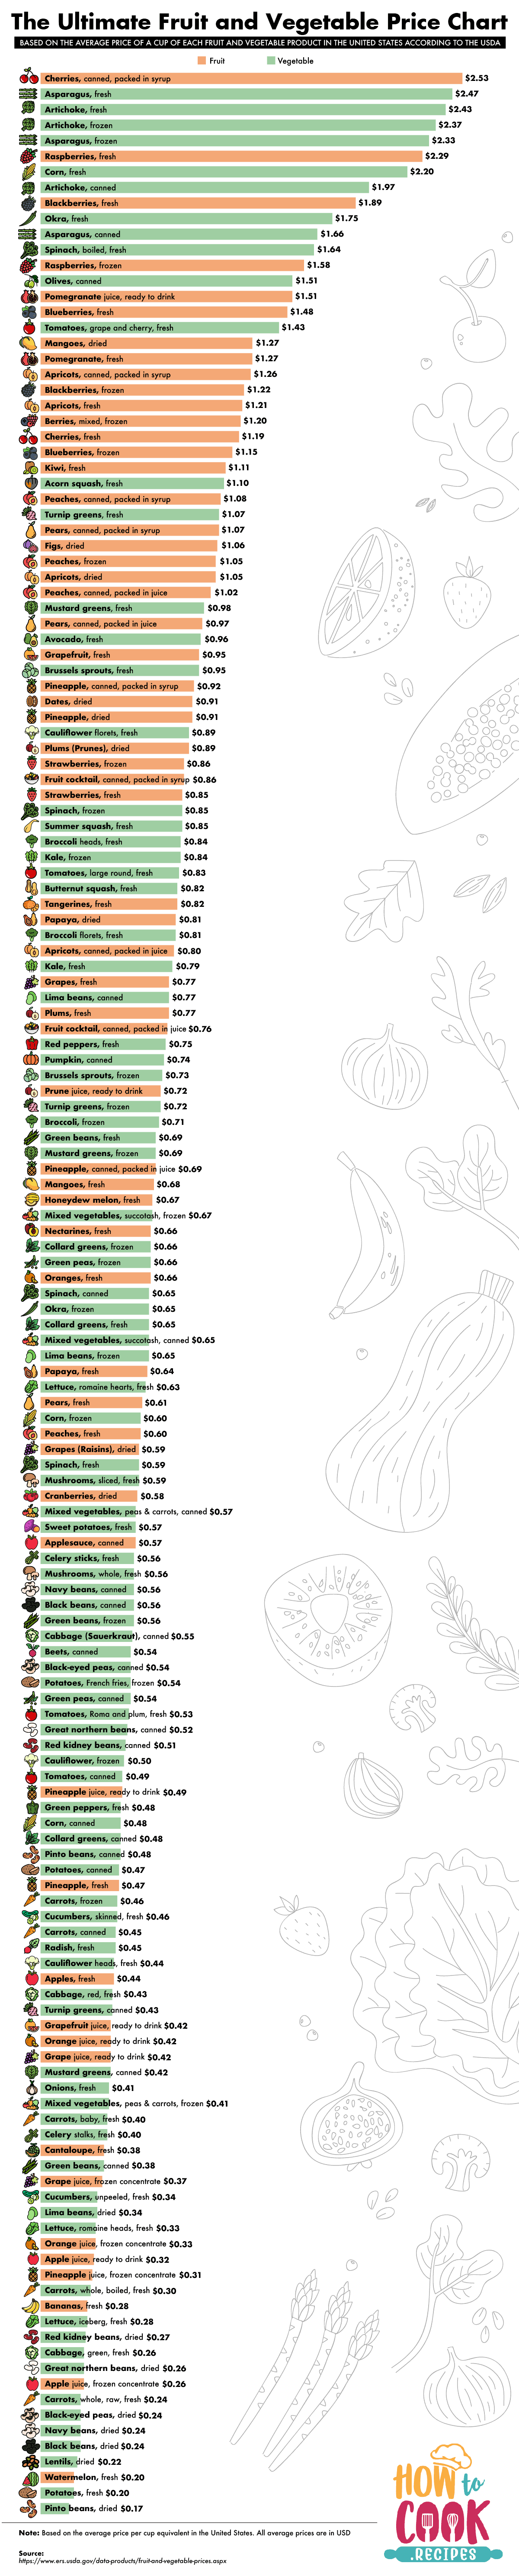
Is the cost of fruits and vegetables holding you back from eating a healthy and more balanced diet? While some products may be on the higher end of the price range, there are plenty of fruits and vegetables that are on the inexpensive side and won’t break the bank. The team at HowToCook.recipes created The Ultimate Fruit and Vegetable Price Chart using information they collected from the U.S. Department of Agriculture to rank a wide variety of fruits and vegetables by their average price per cup in the United States.
With the list color-coded depending on if it’s a fruit or vegetable you can see that vegetables dominate both the top and the bottom of the list, making up some of the most expensive and the least expensive healthy food options to choose from. After comparing the costs on this price chart, are there any fruit and vegetables you’ll be adding or removing from your diet to cut down on food costs?