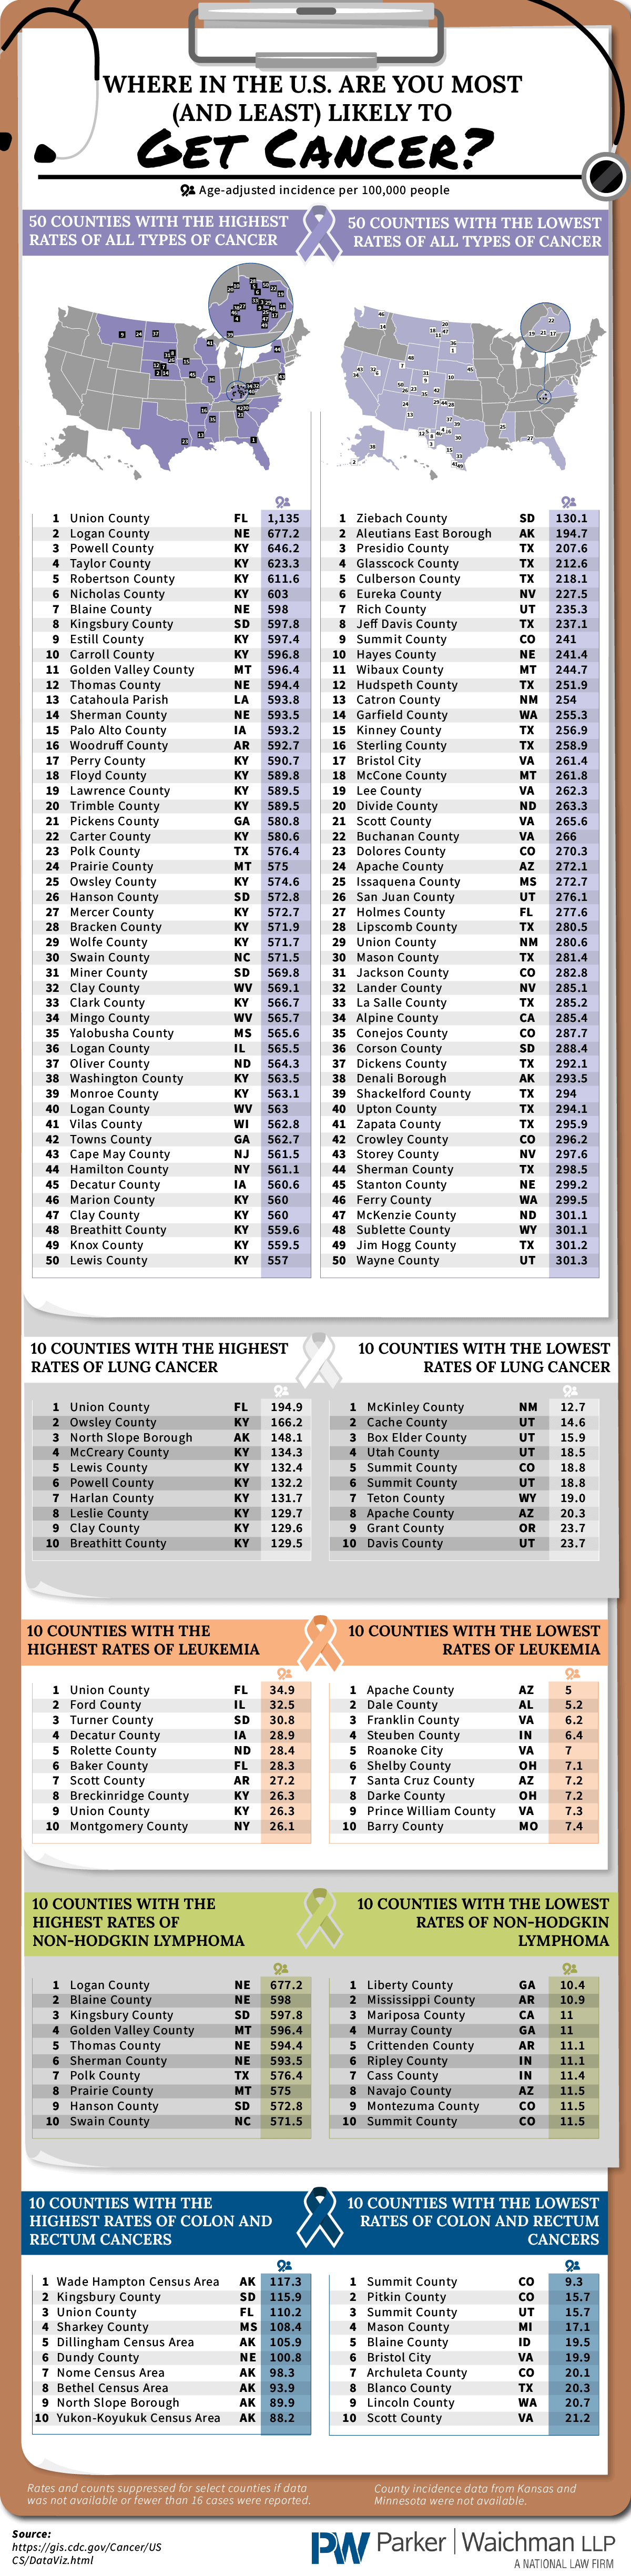
Cancer can start in most areas of the human body. It begins when cells uncontrollably and crowd out normal cells. This makes it challenging for the body to function in the way that it should. In the United States, your likelihood of getting cancer is between 38-40% depending on your gender, race, lifestyle, and location. Fortunately, the fatality rate of cancer is much lower, between 18-20%. Some areas of America experience much higher cancer rates, such as parts of Florida and Kentucky.
There are many steps you can take to help reduce your chances of getting cancer. Cancer.org states that getting regular screening tests, maintaining a healthy weight, exercising regularly, eating a healthy diet, and consuming alcohol only in moderation. This infographic explores the areas with the highest and lowest cancer rates in the United States based on county data. This gives a detailed look that can help shed light on how the environment impacts cancer rates.