Submit Infographics

Home  »  Graphs • Health Graphs • Static   »   The Impact Of Reducing Avoidable Application Chart/Graph

The Impact Of Reducing Avoidable Application Chart/Graph

the impact of reducing avoidable application

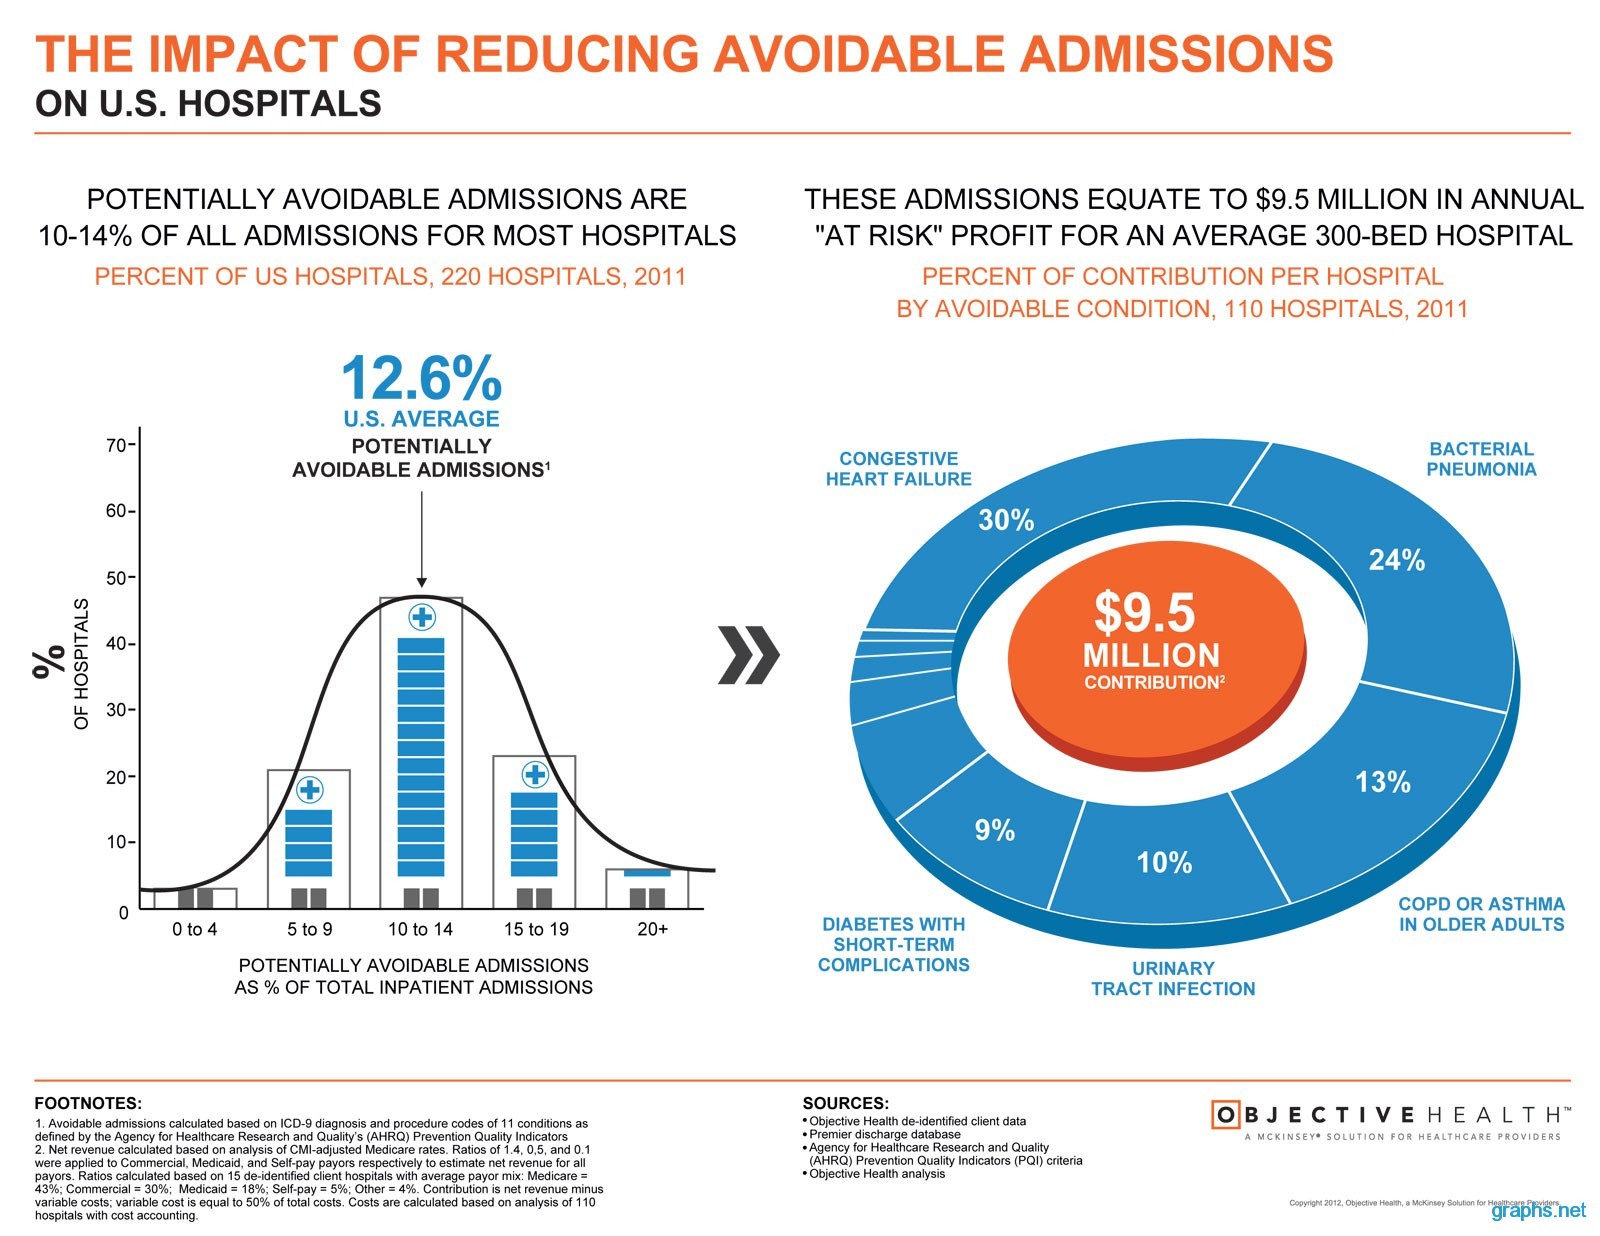
The Agency for Healthcare Research and Quality’s (AHRQ) has clearly stated in the infographic as what’s the impact that this organization creates by reducing the avoidable admissions in United States hospitals. These admissions will fetch a profit of $9.5 million to a hospital with 300 beds.

The profit that hospitals gain can be increased by reducing the admissions for patients suffering with bacterial pneumonia, congestive heart failure, diabetes with less complications and urinary tract infection.

Categories : Graphs, Health Graphs | Published by : graphs | Date : Jul 25, 2012
Tags: major health diseases us, us hospital admission rates, us hospital admission statistics

Credits

Source : http://www.objectivehealth.com/
Add missing credits


Related Posts

5 Ways To Improve Retirement Savings
Facts And Figure About The Forbes Billionaires


Copyright 2020 Graphs.net
i i i
  • Contact
  • Terms of Use
  • Privacy Policy
Scroll Up