Submit Infographics

Home  »  Geography Graphs • Graphs • Infrastructure Graphs • Science Graphs   »   Super Typhoon Haiyan: No Exception

Super Typhoon Haiyan: No Exception

8 2013_11_TyphoonHaiyan_0 (1)

The Philippines, six days after the largest storm ever recorded, is moving fast to bring aid to the hundreds of thousands who have fallen victim to it brutality.

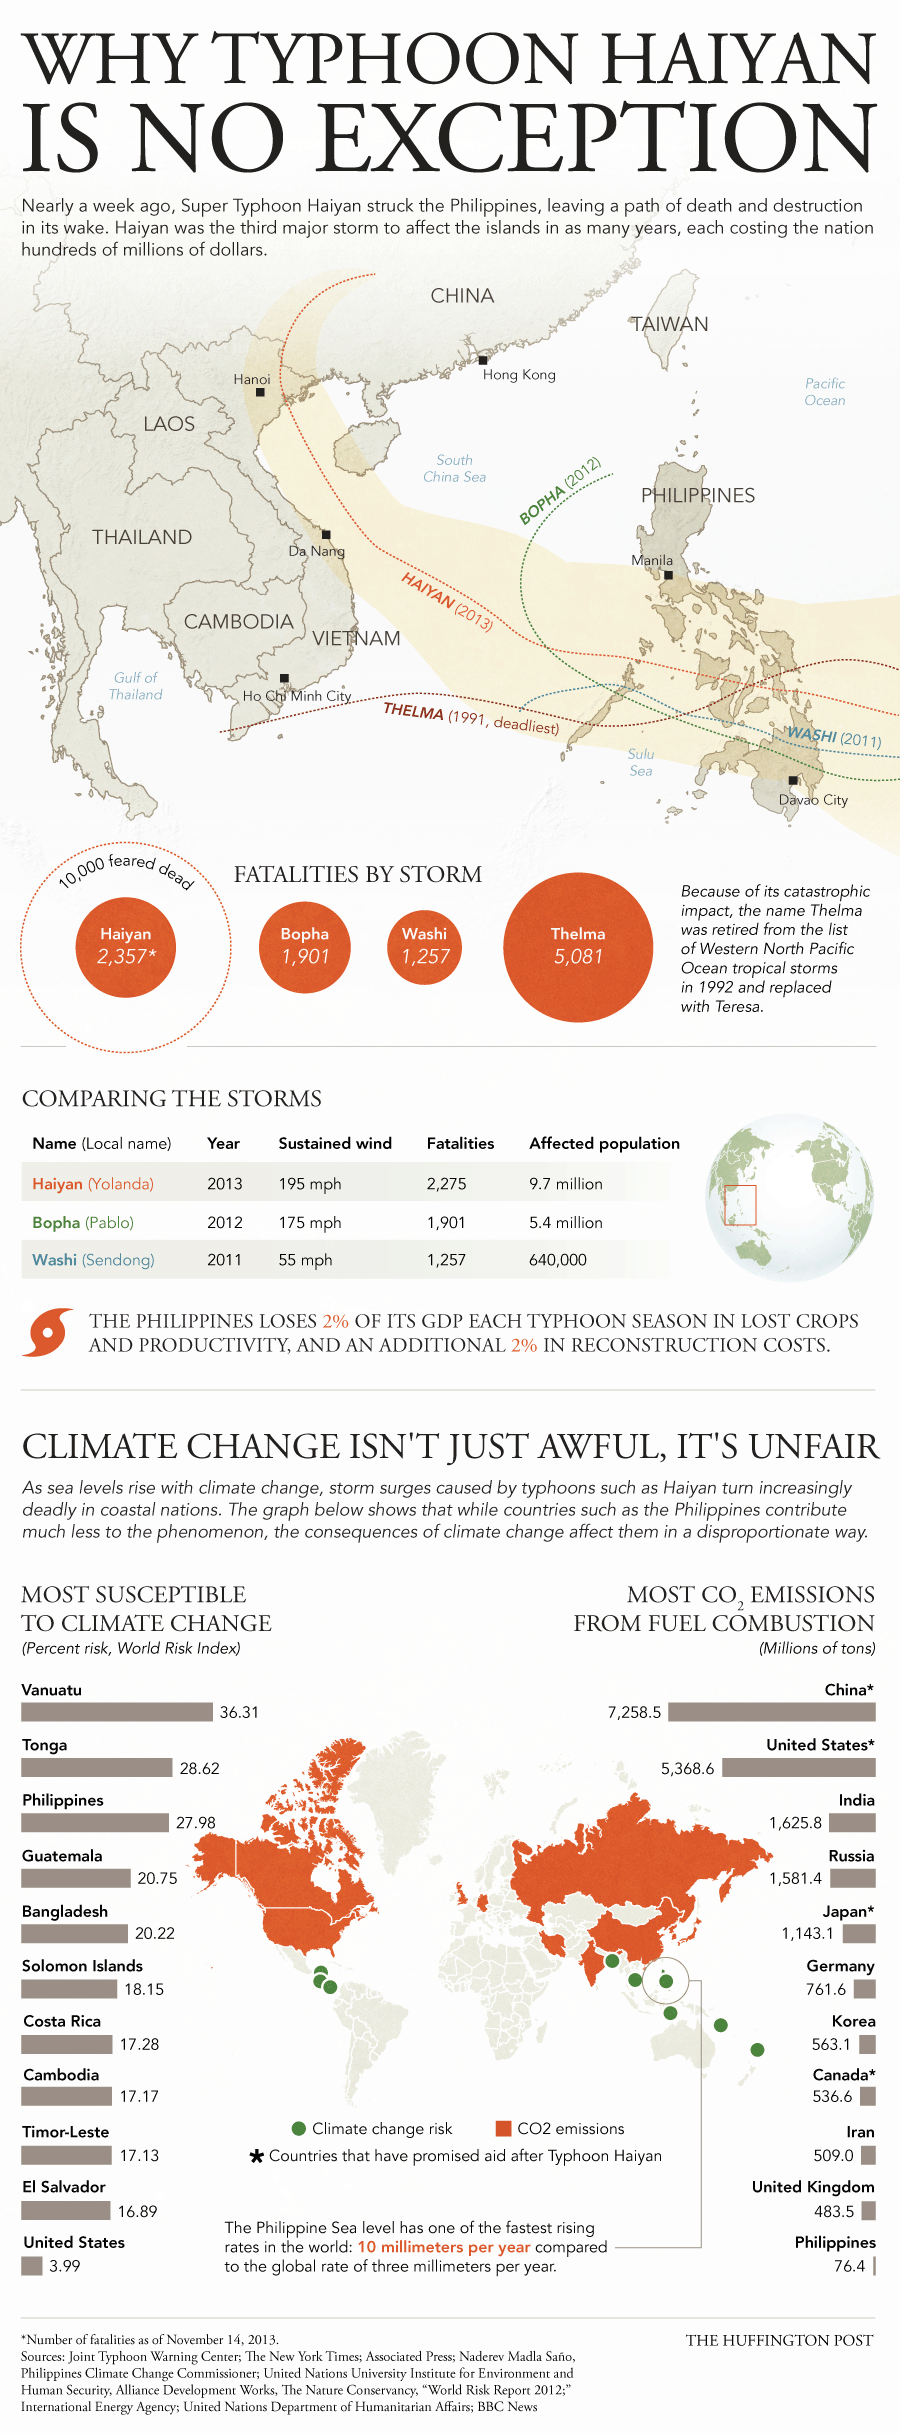
But does it really deserve to bear the brunt of nature’s anger? Devastated by the storms like Typhoon Bhopa and Typhoon Washi, the Philippine Sea levels has the fastest rising rates in the world at 10 milimeters per year.

Philippines loses 2% GDP each typhoon season in lost corps and productivity and an additional in reconstruction cost. This may ofcourse be because Philippines has almost 76.4 Million tons of CO2 emissions every year and is at 27.98% risk of climate change.

Categories : Geography Graphs, Graphs, Infrastructure Graphs, Science Graphs | Published by : infographics | Date : Nov 17, 2013
Tags: climate change due to haiyan, Philippines typhoon, super typhoon haiyan, typhoon yolanda

Credits

Source : http://www.huffingtonpost.com/2013/11/13/typhoon-haiyan-climate-change_n_4269640.html
Add missing credits


Related Posts

X Men: 50 years Of Mutant Past
The Ultimate Guide To Contraception


Copyright 2020 Graphs.net
i i i
  • Contact
  • Terms of Use
  • Privacy Policy
Scroll Up