Road casualties have become regular news. The number count is increasing in number. Though not all but many of them are leading to fatal injuries and even the death of the passengers. Let us go through the following statistics to understand the rise in the graph.
Important facts:
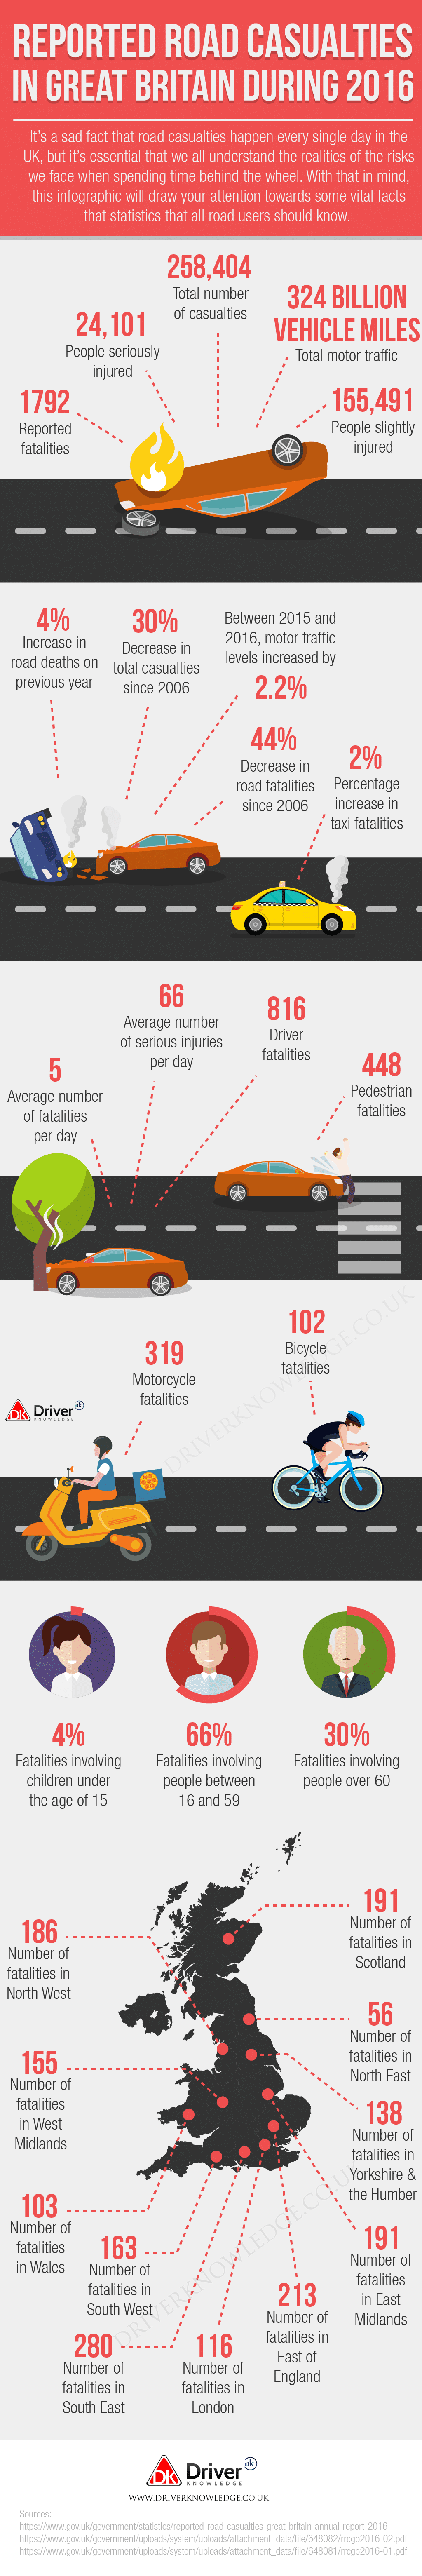
To date, there has been
• 1792 Reported fatalities
• 24,101 People seriously injured
• 155,491 People slightly injured
• 258,404 Total number of casualties
• 324 billion vehicle miles Total motor traffic.
Rise or fall in the count:
● 4% Increase in road deaths on the previous year
● 30% Decrease in total casualties since 2006
● Between 2015 and 2016, motor traffic levels increased by 2.2%.
● 44% Decrease in road fatalities since 2006
● 2% Percentage increase in taxi fatalities
Average rate as per day:
Number of fatalities per day - 5
Number of serious injuries per day - 66
Types of Fatalities:
❏816 Driver fatalities
❏448 Pedestrian fatalities
❏319 Motorcycle fatalities
❏102 Bicycle fatalities
Fatalities by Age:
Children are highly involved in the Fatalities caused by road casualties
4% Fatalities involve children under the age of 15
66% Fatalities involve individuals between 16 and 59
30% Fatalities involve people over 60
Fatalities by region:
➔ In North West, there has been 186 number of Fatalities.
➔ West Midlands witnessed 155 number of fatalities.
➔ 103 Number of fatalities in Wales
➔ 163 Number of fatalities in South West
➔ South East witnessed 280 numbers of Fatalities.
➔ 116 Number of fatalities in London
➔ 213 Number of fatalities in East of England
➔ 191 Number of fatalities in East Midlands
➔ There have been 138 Number of fatalities in Yorkshire & the Humber
➔ 191 Number of fatalities in Scotland
➔ 56 Number of fatalities in North East
This infographic by Driver Knowledge gives you a detailed report on road casualties in Great Britain during 2016.