With present life style the risk of diseases has increased. Diseases like cardio vascular diseases, cancer, and type 2 diabetes are at their highest.
These diseases are affecting all kinds of ages starting from 20 and as the age increases humans become vulnerable to them. Most of these are curable but an attempt to prevent them is better than cure.
Melanoma: Both males and females of all ages are Vulnerable to it.
Cervical Cancer and Ovarian Cancer: It is caused by the HPV (Human Papilloma virus) and all women after the age of 20 are vulnerable to it.
Testicular Cancer: 15 % of males from age 20 are vulnerable to it, chances for cancer increases with increase in age in males.
Breast Cancer: it is better to diagnose oneself with a family history of breast cancer women after age 30 are most vulnerable.
Prostate cancer: Increased risk after 40.
Colon cancer: Increased risk after 30.
Heart disorders: increased risk after 30
Cholesterol: High cholesterol levels from the age of 20
Osteoporosis: Common disorder seen in woman after 50
Diabetes type 2: Equal chances of type 2 diabetes in both male and females after 30.
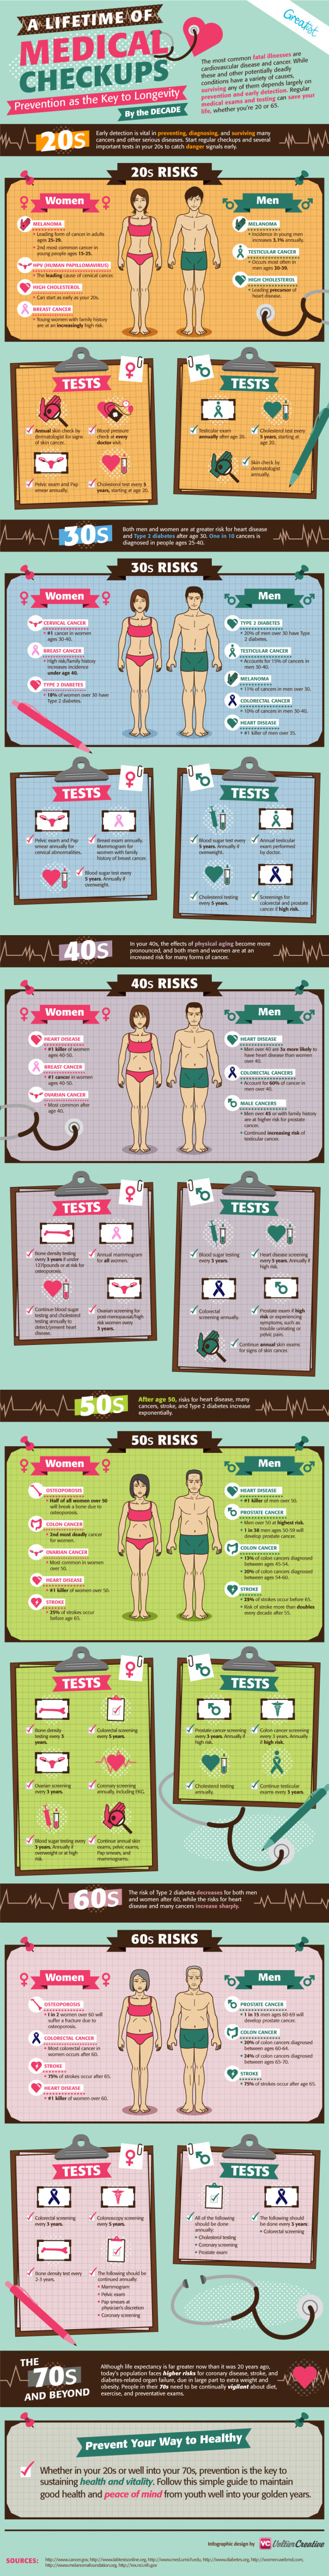
The following info graph illustrates the diseases and diagnosing mechanisms with respect to age.