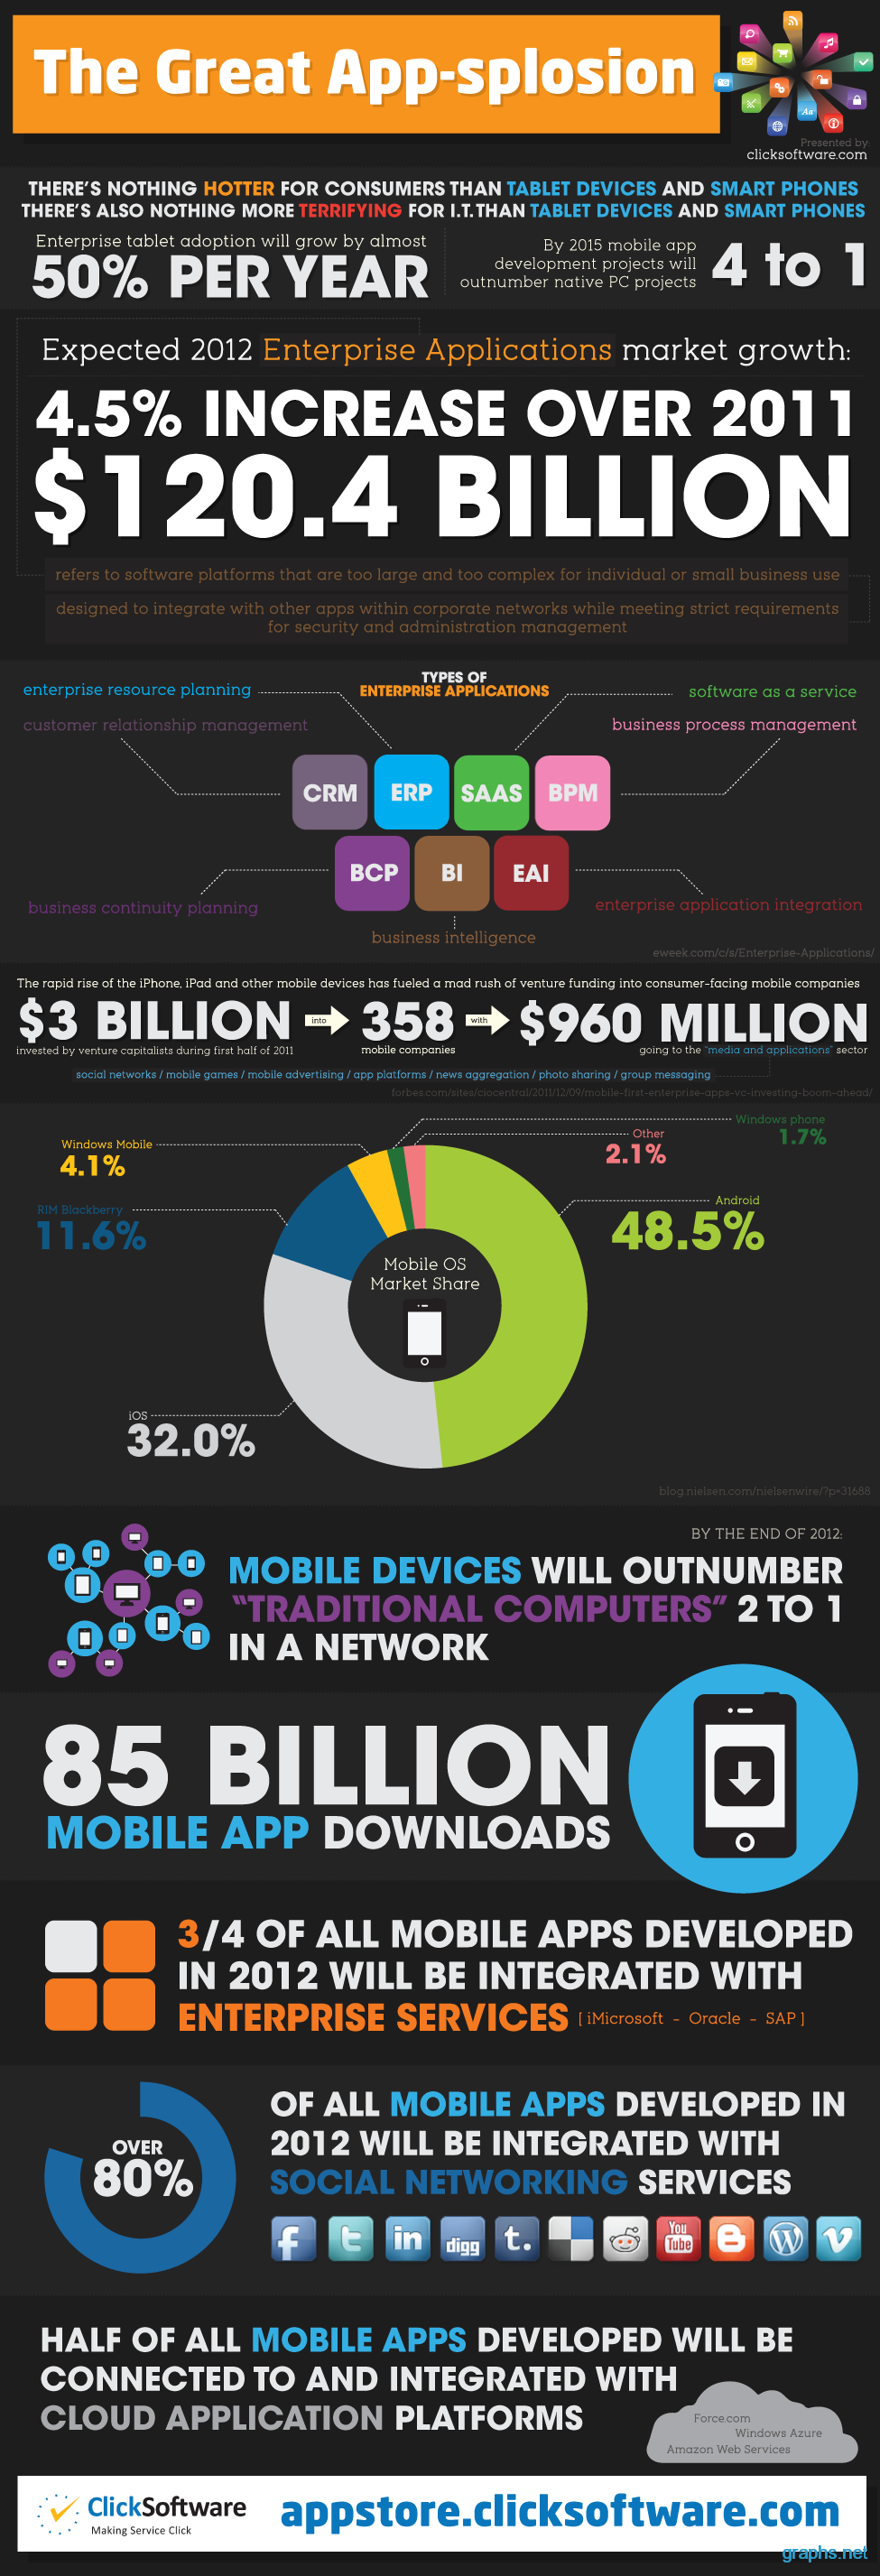
There are more number of mobile app development projects when compared to development of enterprise applications that run on native personal computers. But still a survey shows that by 2011, there will be a minimum of 4.5% increase in the growth of enterprise applications market. This gradual growth can help companies to generate overall revenue of $120.4 billion.
It is been predicted that by the end of 2012, the usage of mobile devices for network will surpass the personal computers and out of every 3 in 4 mobile apps developer by the app developing companies will be integrated into social networking and enterprise services.