A student can be defined as someone who is eager to learn new things by attending some educational institute. He/she is awarded with a degree or certificate of completion of a course or subject of learning, in case he or she complete the period of the course by attending required classes and passing all necessary exams related to it.
Students studies at various levels, this may include studying at high school, colleges, universities or opting for a professional course or merely learning a language or researching about a subject, etc. Even the adults that are taking training or pursuing some vocational courses are considered students.
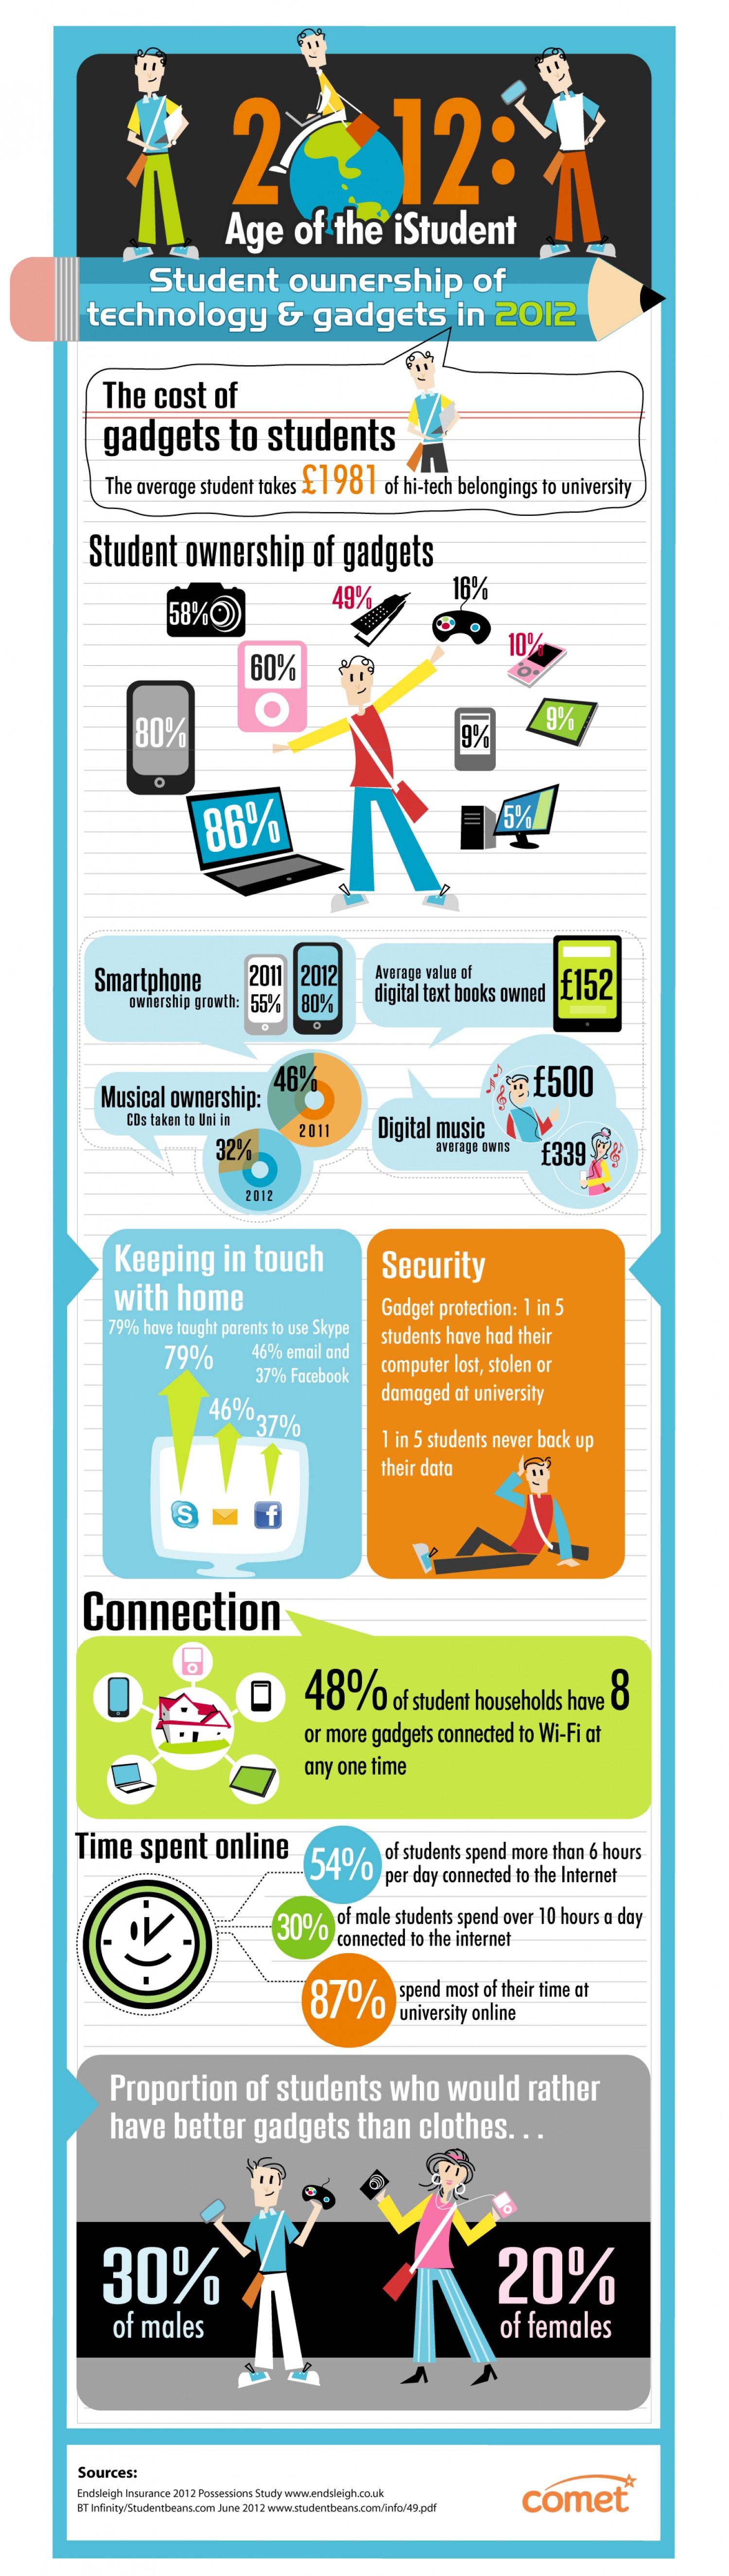
1. Gadgets And Students
Data suggested that an average student takes gadgets costing 1981 pounds to university. 80% of pupil takes their mobile phones to university, 16% takes play station, 86% takes laptop, 5% takes computer, 60% takes IPod and 58% took camera. 48% of students have 8 or more gadgets connected to Wi-Fi.
Source
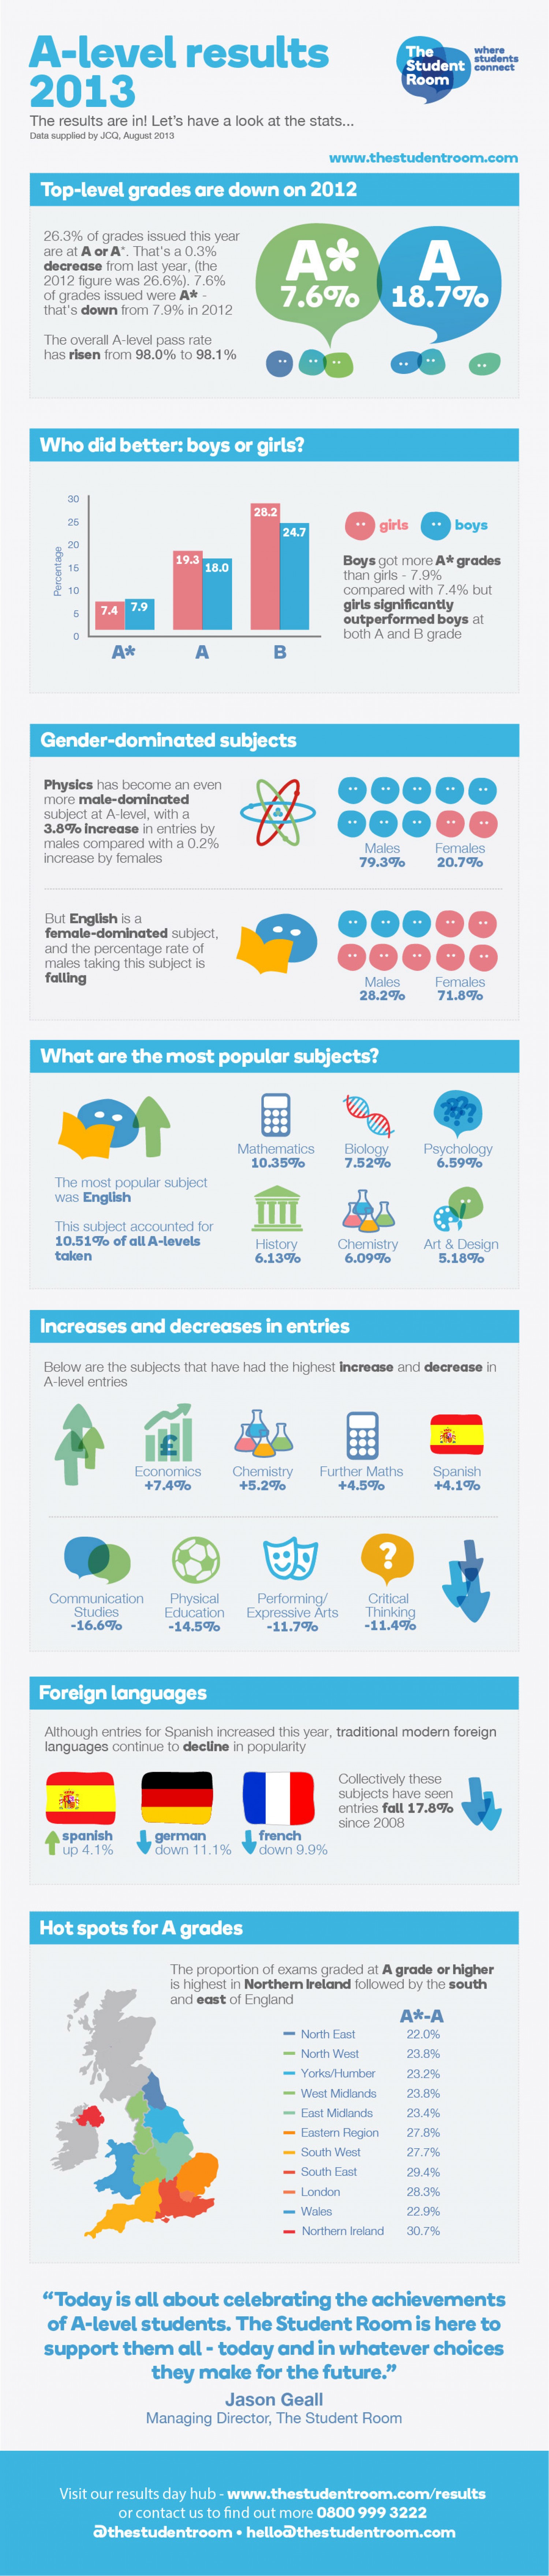
2. Boys Score Better Than Girls
Boys are found to be scoring more ‘A+’ grades than girls accounting of 7.9% of total while girls account for 7.4% of the total. However, girls beat boys both in scoring “A” grades and “B” grades. The subject Physics is male-dominated and English is female dominated.
Source
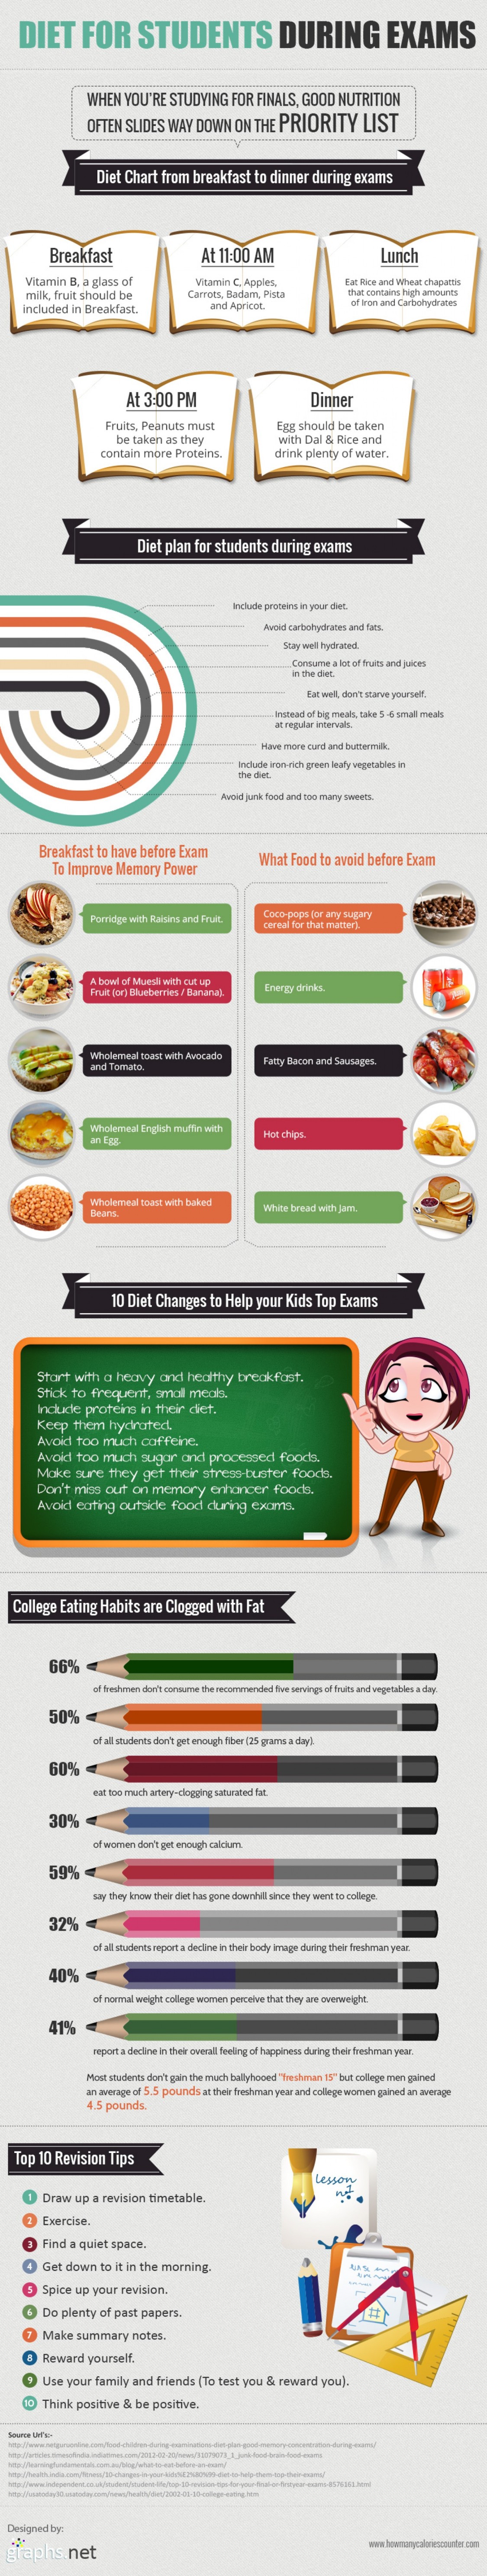
3. Diet For Students During Exams
This diet can be suggested to students during exam time. A pupil can have Vitamin B, a glass of milk and fruits for healthy life. At 11:00am they can eat vitamin C, apples, carrot and Pistachio and Apricot. At lunch student can opt for rice, wheat and chapattis that contained Iron and Carbohydrates. Light food can be opted at night.
Source
4. Understanding Student Loans In Real Terms
The average credit card debt on a student in US is near about $15, 956. The statistics also suggested that 2/3 of all the students graduated with students. 62% of people graduate from public schools and 72% from non-profit organizations.

Source
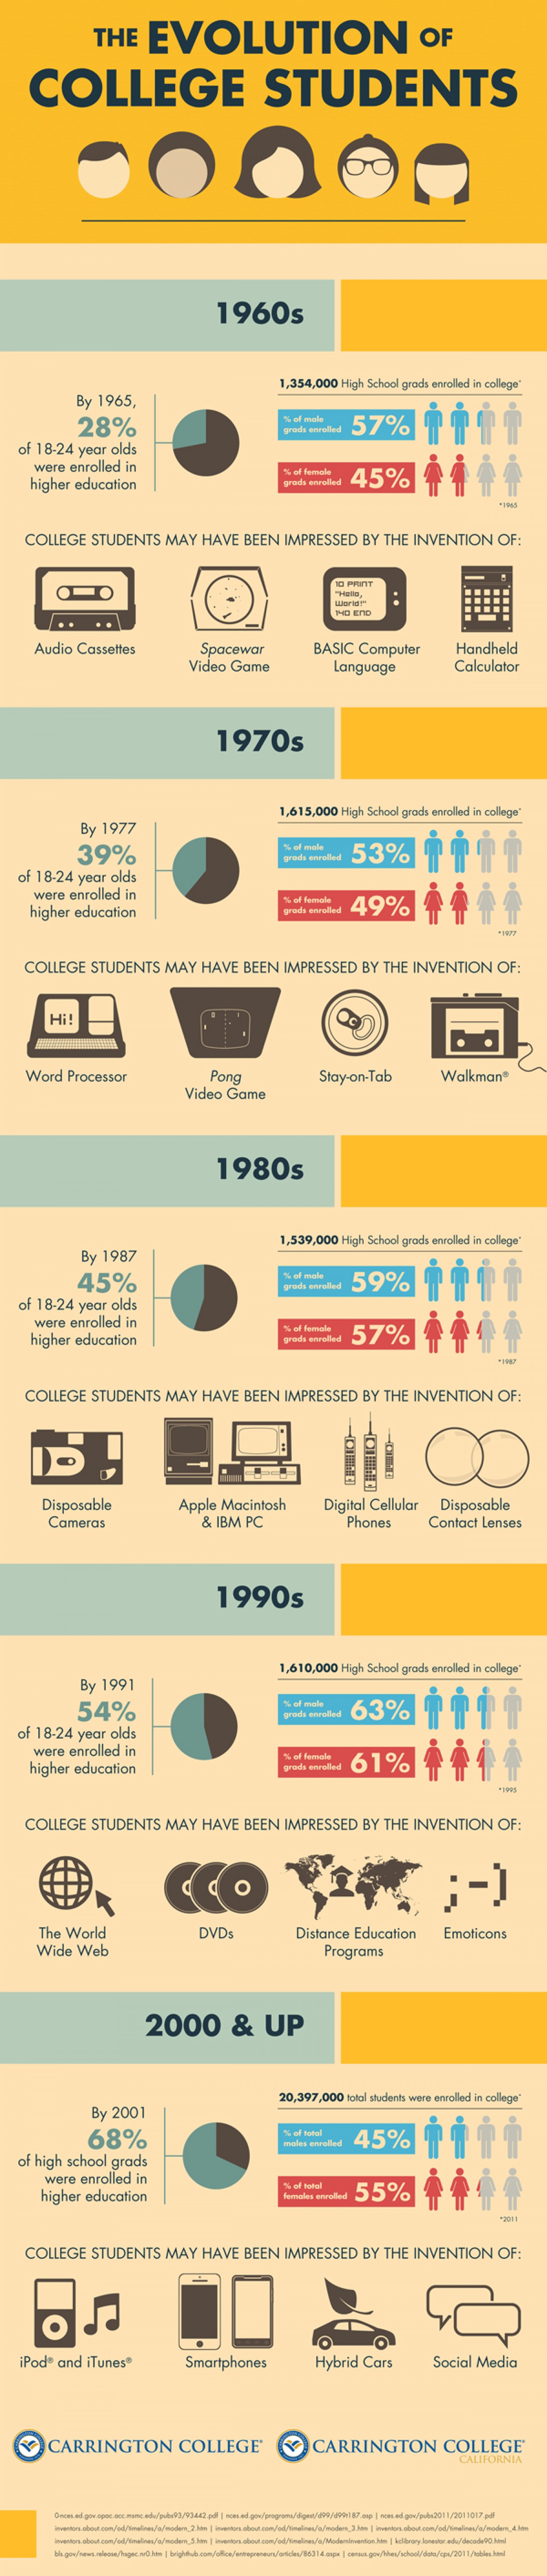
5. The Evolution Of A College Student
An average of 1,354,000 high school graduate students gets admitted in colleges every year around the globe. The data suggested that 57% of male graduates enroll in college and 45% of female graduates get admissions in colleges.
Source
6. iPhone 5 Vs Student Loans
The retail price for I phone 5 is $650; however, total loan allotment for a student in US for starting in a university is $5,500. The average monthly bill of I phone is $100 and above but the average monthly payment on standard 10 year plan is $55 per month.
Source
7. What Students Say Vs What Parents Think - Student Finance
28% of students admit that they are living on overdraft and 8% of parents believe that they are spending their overdrafts. A total of 1 in 5 students utilize credit cards for daily purchases. 1 in every 3 parents believes that their kids have credit cards. 1 out of 3 students dip into their savings.
Source
8. Time Management for Students
High school is compulsory and college is optional. Studying in high school is free of cost and studying in a college can be real expensive. The time of a pupil is structured by others in a high school however, it need to be maintained by you in college. The classes are arranged, rather allocated by students in high school, however, it is scheduled by students themselves in college.
Source
9. The True Cost Of Skipping Class
The average expense of studying in a public 4 year college is nearly about $8,737. However, the same is $21,324 in a private college. An average student skips 13 classes per semester and 26 classes per year. This accounts for a total of 104 classes in their whole college life.

Source
10. Selling Software To College Students
A total of 20.4 million students currently enroll in colleges all around the globe. Out of which 9.4 million students have purchased software in last 12 months. This trend is growing at a faster rate. It is suggested to face a rise of 4% between the years 2010-2019.
Source
11. Who Gets The Financial Aid
Study conducted in regards to find out who among the students gets the financial aid discovered that 66% of all undergraduate students received the aid; the number was 80% in fulltime undergraduate students. The aid percentage was found to be 74% in graduate students.
Source
12. College Student Debt
The tuition fee at the colleges has increased up to 500% in colleges since 1980. The cost of living has increased up to 325% from then and medical expenses have increased to near about 600% from the year 1980. The cost of studies that follows in 2012 is equivalent to cost of studying for 27 years with the fees that follows in year 1980.

Source
13. Students And Voting
The share of students in voting was 14.3% in year 2000, nearly 16% in 2004 and about 17.1% in year 2008. Out of the total population of 131 millions of voters only 22.4 million opted for voting and 8.4 million of them were students between the ages of 18-24 years.
Source
14. Student Advocacy Results
Students nowadays need advocacy help at a greater level. Stats suggest a total of near about 844 families requested for help in a year. Out of which 693 families were served with near about 92% of success rate.
Source
15. The Student Experience Online
Resources suggested that there are nearly 21.6 million students in the world who plan to attend the college. 5,000 of them apply for admission in the desired institution through the means of internet.
Source
16. The Student Body - The Great Technology Divide
Researchers found out the fact that 89% of students reach for their smart phones within 15 minutes of waking up. 74% of them reach their phones immediately when they wake up. The average number of time a student login into his Facebook account during the day is 13.8 times.

Source
17. Student Recommendation Rates 2010
A survey conducted on near about 31,902 students all the results about their desire of recommending Kaplan to their family and friends found that 80-90% of student responded in positive way. The research was carried on students from 70 countries in year 2010.
Source
18. Student Textbook Survey
Pupils were asked during a survey that if they buy only the required text book for their courses. 76.6% of them replied in negative, however, 23.4% of them agreed with the fact. 59.4% of pupil said they buy second hand books, 25% choose new books, and however, 15.6% of them go for other options.
Source
19. Preparing Students For The Future
Five ways of preparing a student for future competition includes using video aids for education, embracing video games for brain sharpening, encouraging on the go study, teaching digital citizen ship and flipping classes. Lessons taught from home videos are found to be more effective.
Source
20. Healthy Meals In Schools And Universities: Important Or Not?
National food standards were introduced in colleges and universities to make sure that the students are served with appropriate food. The standards suggested 42% of less saturated food and 27% of food less in sodium content.
Source