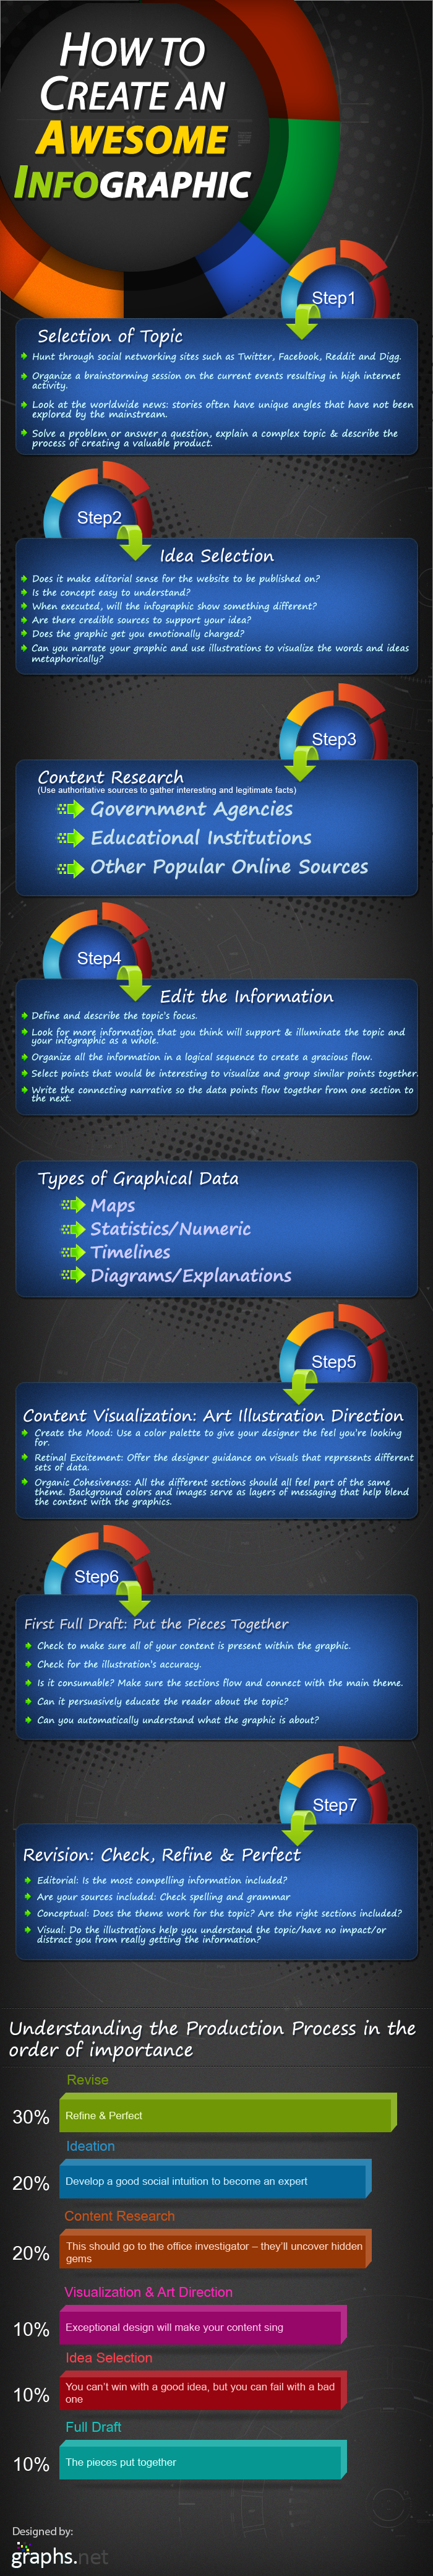
To create an awesome infographics, you need to follow the following given 7 step procedure:
The first step is to select a topic which can be done through social networking websites. You can organize a brainstorming session on the current events resulting in high internet activity and search for unique stories. The next step is to select and idea.
Your idea must make editorials sense for the website that it is going to be published on in addition to having an easy concept, being unique, having enough credibility and should be able to get a person emotionally charged up.
The third step involves content research which can be done through governmental agencies, educational institutions and popular online sources. Step 4 involves you to edit the information. This step might need you to define and properly describe the topic’s focus and organizing all the information in a logical order to create a flow.
You must select only those points that would be interesting to visualize. Step 5 of this process is content visualization and art illustration direction. You must be able to create the mood using a color palette and offer the designer guidance on the visuals representing different sections of data.
One thing to keep in mind is that all the different parts must be part of the same theme and should be well blended together. The last two steps involve putting all the pieces together and refining the infographic while at the same time checking for errors and perfecting the final draft.