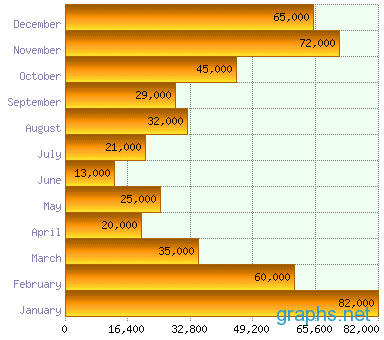
To further your audience’s understanding of the business data you are presenting, it is crucial to use business graphs in your presentation. It gives a quantitative analysis to your framework and your data and explains quickly and clearly the complex information you are presenting.
But sometimes, the challenge is to find the exact business graph to best use for your presentation. Let us examine the most common ones and which are the best suited for your type of information.
Histograms are useful when you want to summarize large data sets graphically and you don’t want to confuse them with all the numbers and statistics. It is also useful when you want to compare measurements to specifications; for example, whether the current new process has improved the production of goods in the factory. Lastly, histograms can be a powerful tool to help in the decision making process, since the data is presented in a clear-cut manner, without all the pesky little details that serve as “white noise”.
Bar charts can be divided into two categories. Vertical bar charts work when you have less than five data points and you want to emphasize quantity over a certain period of time. Horizontal bars are best used when you want to show the highest profit, the lowest interest rate, or the most products sold, or you want to rank variables from largest to smallest.
When you’re talking about percentages, portions or shares, a pie graph is the best way to go. However, when you are presenting scientific or technical data, it is not recommended since it’s hard to compare different sections of a pie chart or across different pie charts
When you want to show a growth, decline or a trend over a long period of time and with more than five data points, line graphs are the best way to go. The slope of the line will show the audience at one glance the direction of the data you are presenting
 So given the definitions and examples, it is now time to choose which business graph will best suit your presentation.