Water on Earth moves in a cyclic process, water from rivers reach Sea and gets evaporated and cools down as rain which finds its way into the rivers.
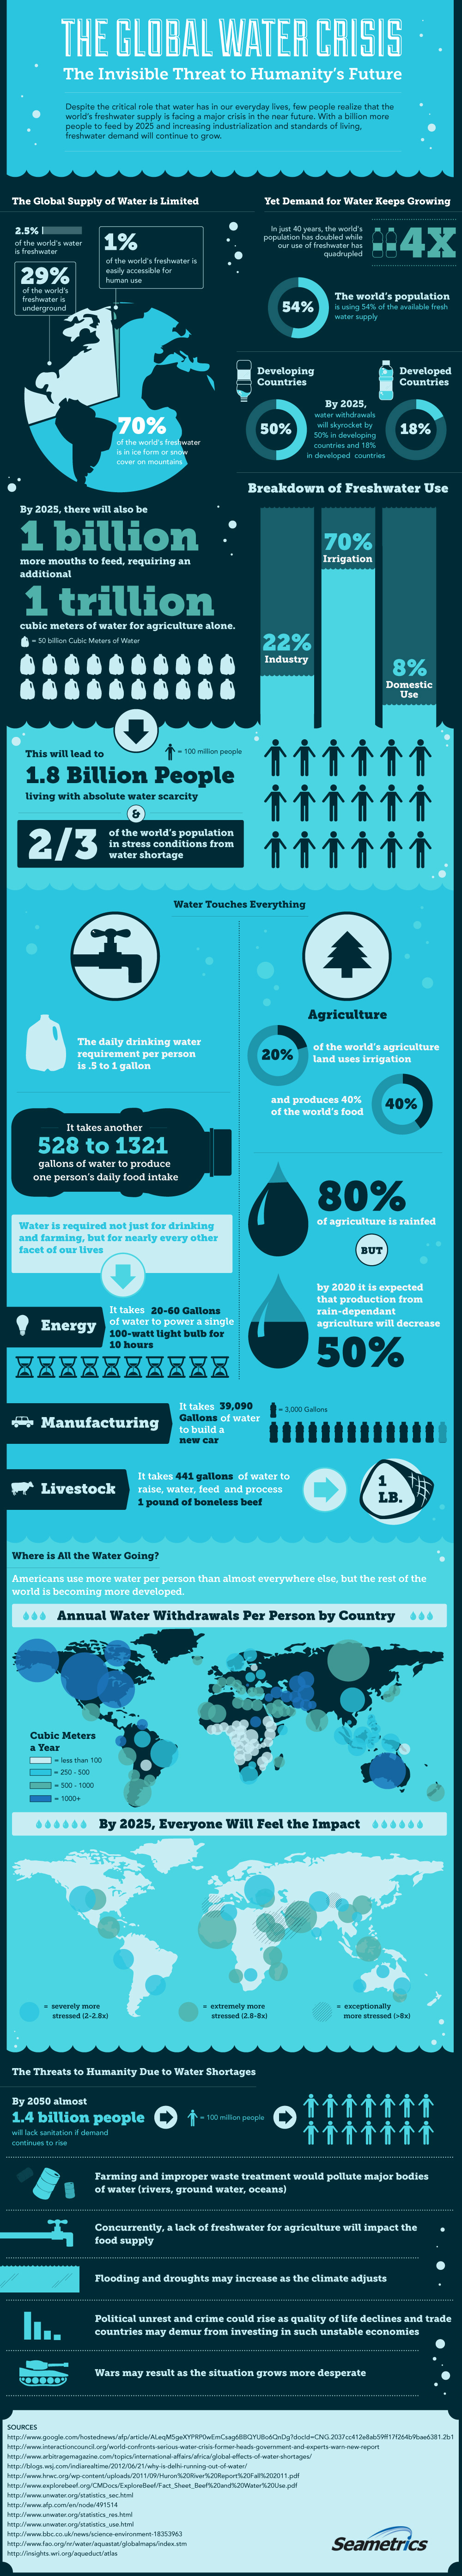
Global demand for water is increasing day by day. In the last 40 years the demand for water has increased fourfold. Population all over the world is using about 54% of the fresh water.
But fresh water content in the world is declining day after day. Fresh water on earth accounts for 2.5% of whole water on earth, out of which 70% is in the form of glaciers and 29 % is in the form of underground water. Only 1% of fresh water is easily accessible to us.
By 2025 the water usage by developing countries increases up to 50% and 18% by developed countries. By 2025 an additional 1 trillion cubic meters are required as the population is going to increase this will lead to 1.8 billion people living with absolute scarcity of water and 2/3 of the population are in stress condition from water storage.
With this scarcity of water humanity might face numerous threats including lack of proper sanitation, polluted water bodies, decrease in agriculture productivity, political unrest and wars for water recourses.