Submit Infographics

Home  »  Health Graphs • Static   »   Fast Food Nutrition Chart/Graph

Fast Food Nutrition Chart/Graph

fast food nutrition chart


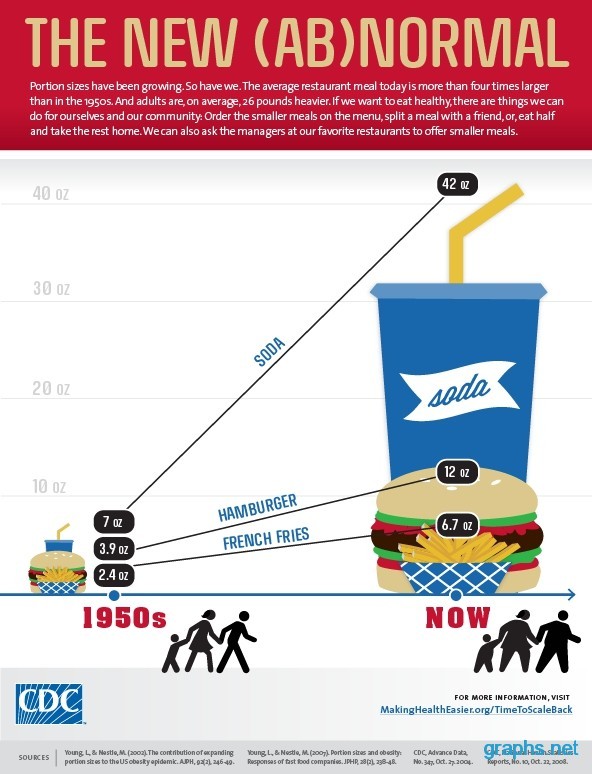
When compared to 1950’s, the rate at which fast food is being consumed by the adults has increased by a huge mark. The portion size of meal that people intake today at restaurant is four times more when compared to meals that were eaten during 1950.

On an average, the adults in current world are 26 pounds heavier than the normal weight these adults must hold according to the BMI (Body Mass Index) measurements. Adults in 1950 used to consume soda of 7 oz and French fries of 2.4 oz. With a gradual time change, even the soda consumption has reached 42 oz in a single serving.

Categories : Health Graphs | Published by : graphs | Date : Jul 9, 2012
Tags: fast food calorie counter, fast food facts, fast food soda calories, french fries calories, hamburger facts, obesity in america

Credits

Source : http://makinghealtheasier.org/newabnormal
Add missing credits


Related Posts

The Process Of Video Production
Christmas Story – The True History


Copyright 2023 Graphs.net
i i i
  • Contact
  • Terms of Use
  • Privacy Policy
Scroll Up