Submit Infographics

Home  »  Economy Graphs • Static   »   Falling UK Pound Graphs

Falling UK Pound Graphs

According to analysts, there are many factors driving the British pound lower over the last 9 months including weak economic data, strong technical downtrend, GBP/JPY selling and a breakdown in the British pound / oil price correlation.

It is hard to analyze the performance of the British pound. But the pound was weaker against the dollar, euro and yen than earlier times. Especially against dollar, the pound seems to be lower than ever.
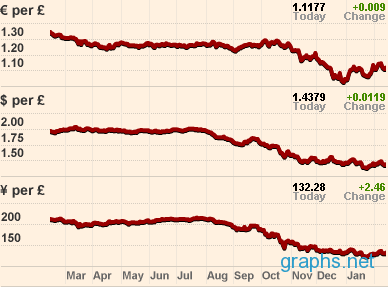
source: FT

Categories : Economy Graphs | Published by : graphs | Date : Feb 13, 2009
Tags: currency graph, falling uk pound analysis, falling uk pound graphs currency, falling uk pound graphs dollar

Credits

Source : #
Add missing credits


Related Posts

Cost Of Being BATMAN
Why are Social Games Popular?


Copyright 2020 Graphs.net
i i i
  • Contact
  • Terms of Use
  • Privacy Policy
Scroll Up