Infographics or infographs in short, are all over the internet. They are a typical medium of communicating different kinds of data, putting it together briefly and to the point, with relevant graphic illustrations that effectively increase the engagement of the readers.
Before jumping into the infograph facts, let’s take a brief look at the structure of infographics. It has three components: the visual, the content and the knowledge.The visual contains colors and graphics (either theme or reference). Statistics and facts usually make the content part of the infographic. And finally, the insight into the data presented is the knowledge.
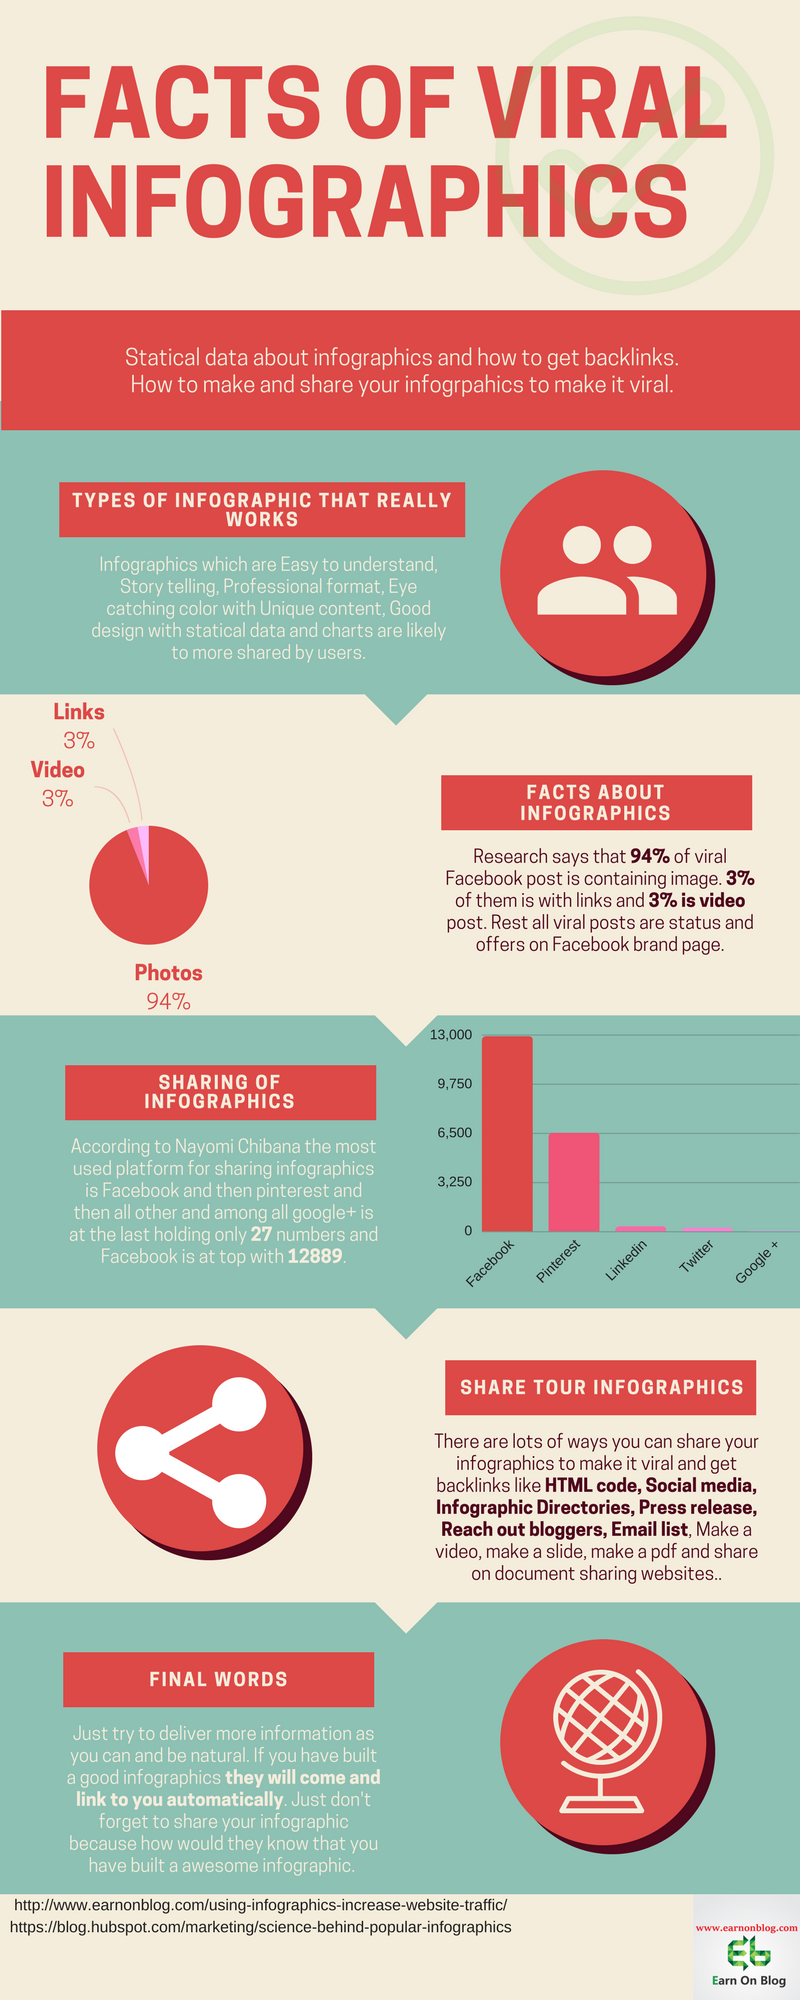
Here are some fun facts about infographics :
- 90% of information transmitted to the brain is visual
- Posts based on pictures have 600 times more engagement than plain text-based posts on social media
- Between the time from 2011 to 2013, the search volume for infographics increased by over 800%
- Today, 83% of the total learning is done visually
- 93% of communication today is non-verbal
- The two top image-based social media platforms, Pinterest and Instagram gained 70 million and 200 million users respectively, in just two years
- People are likely to perform 323% better at a task if they follow directions with both illustrations and text,compared to people following only text-based instructions
- If you Google the term “infographics”, you will get more than 20 million search results