Cars are one of the most used and popular means of transport in most parts of the world. If you are interested in reading more about cars, then the following given information will be useful for you.
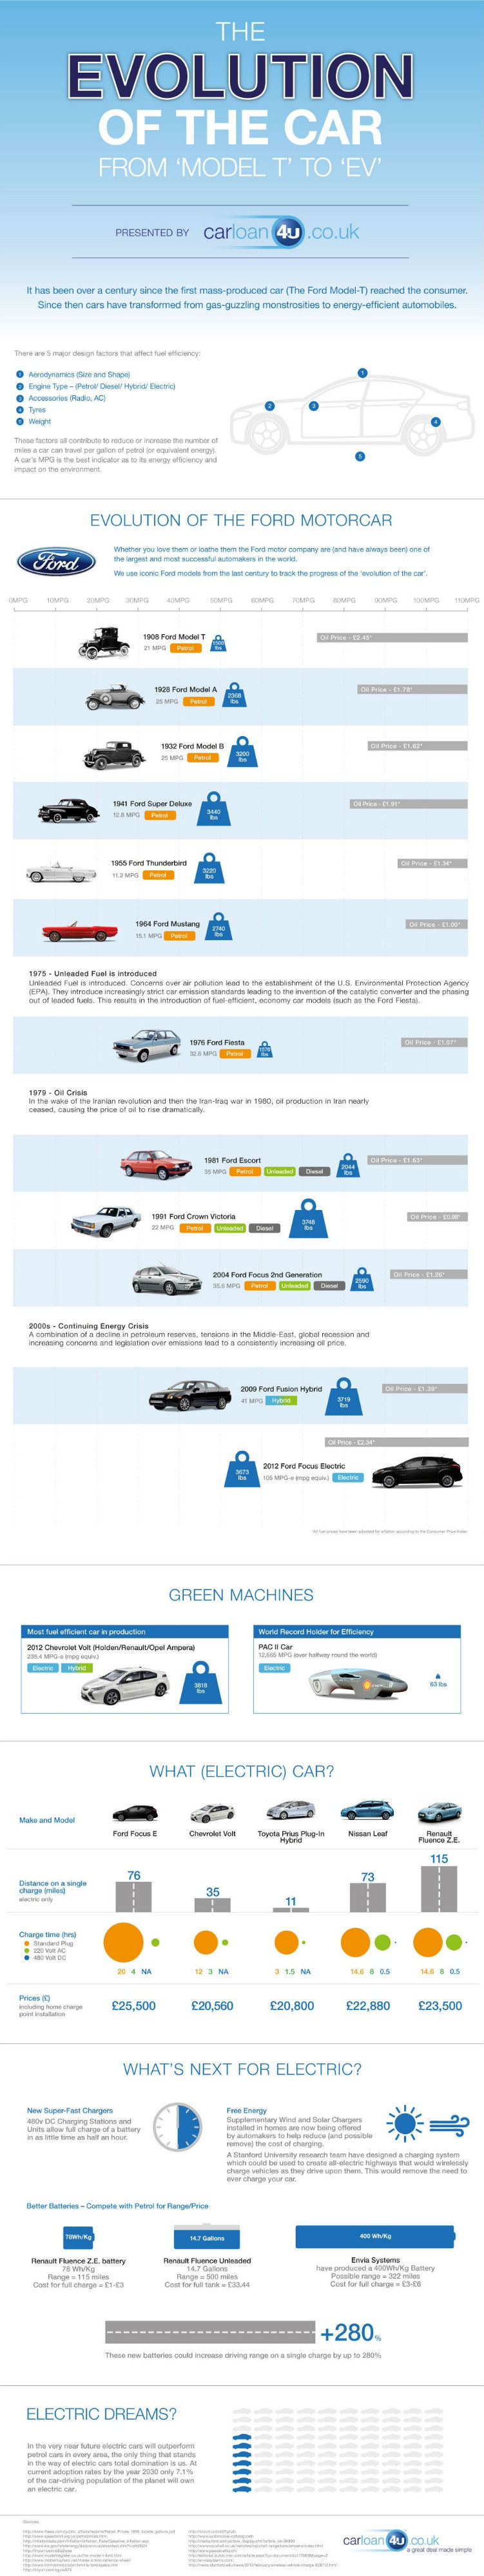
The evolution of a car
The first mass produce car was the Ford Model T and it has been over a century since it reached the consumers. Since then cars have come a long way. Currently the most fuel efficient car in production is the Chevrolet Volt whereas the car that holds the record for efficiency is the Pac II Car.
Source
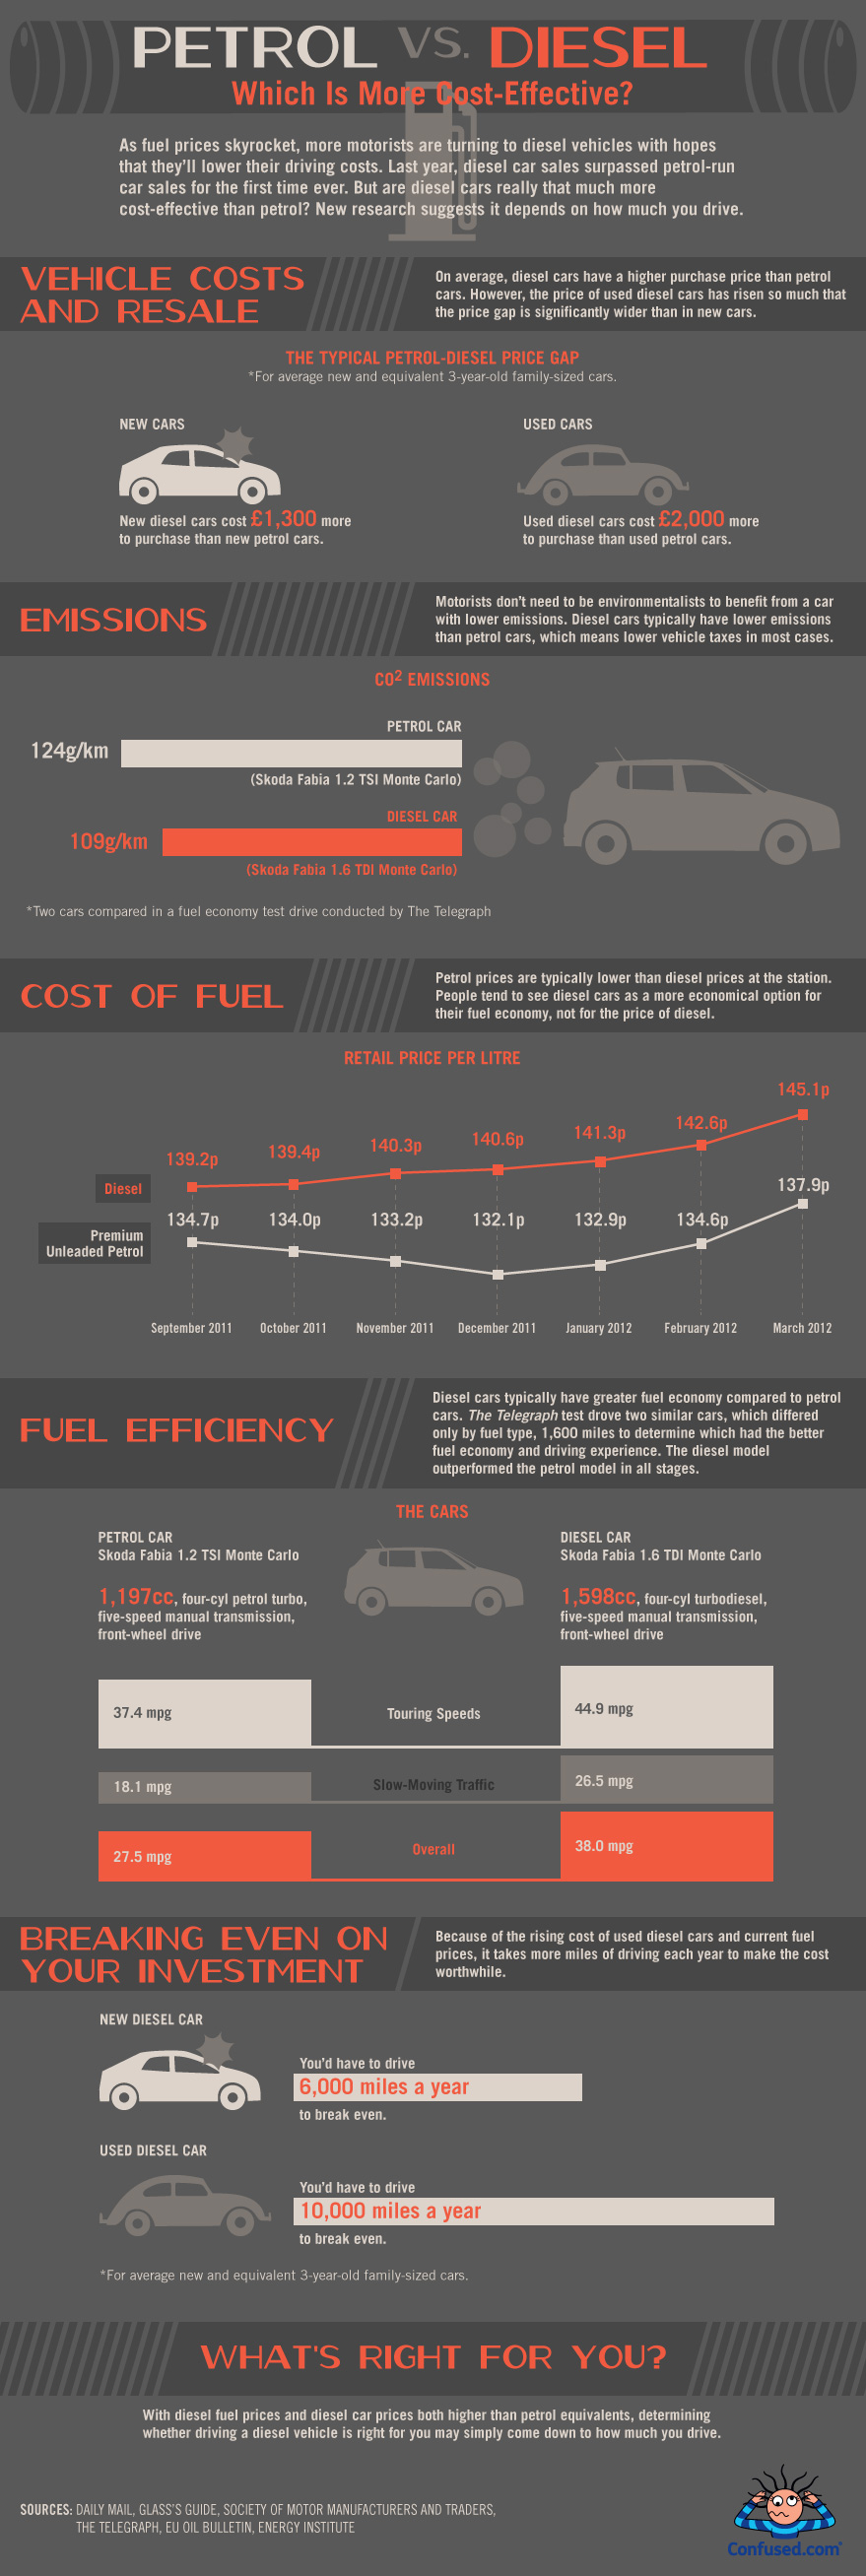
Petrol vs. Diesel
On average diesel cars have a higher purchase price than that of petrol cars but at the same time, the price of diesel cars has also risen considerably. Infact petrol prices are typically lower than diesel prices at the station. The diesel cars also have greater fuel economy than petrol cars.
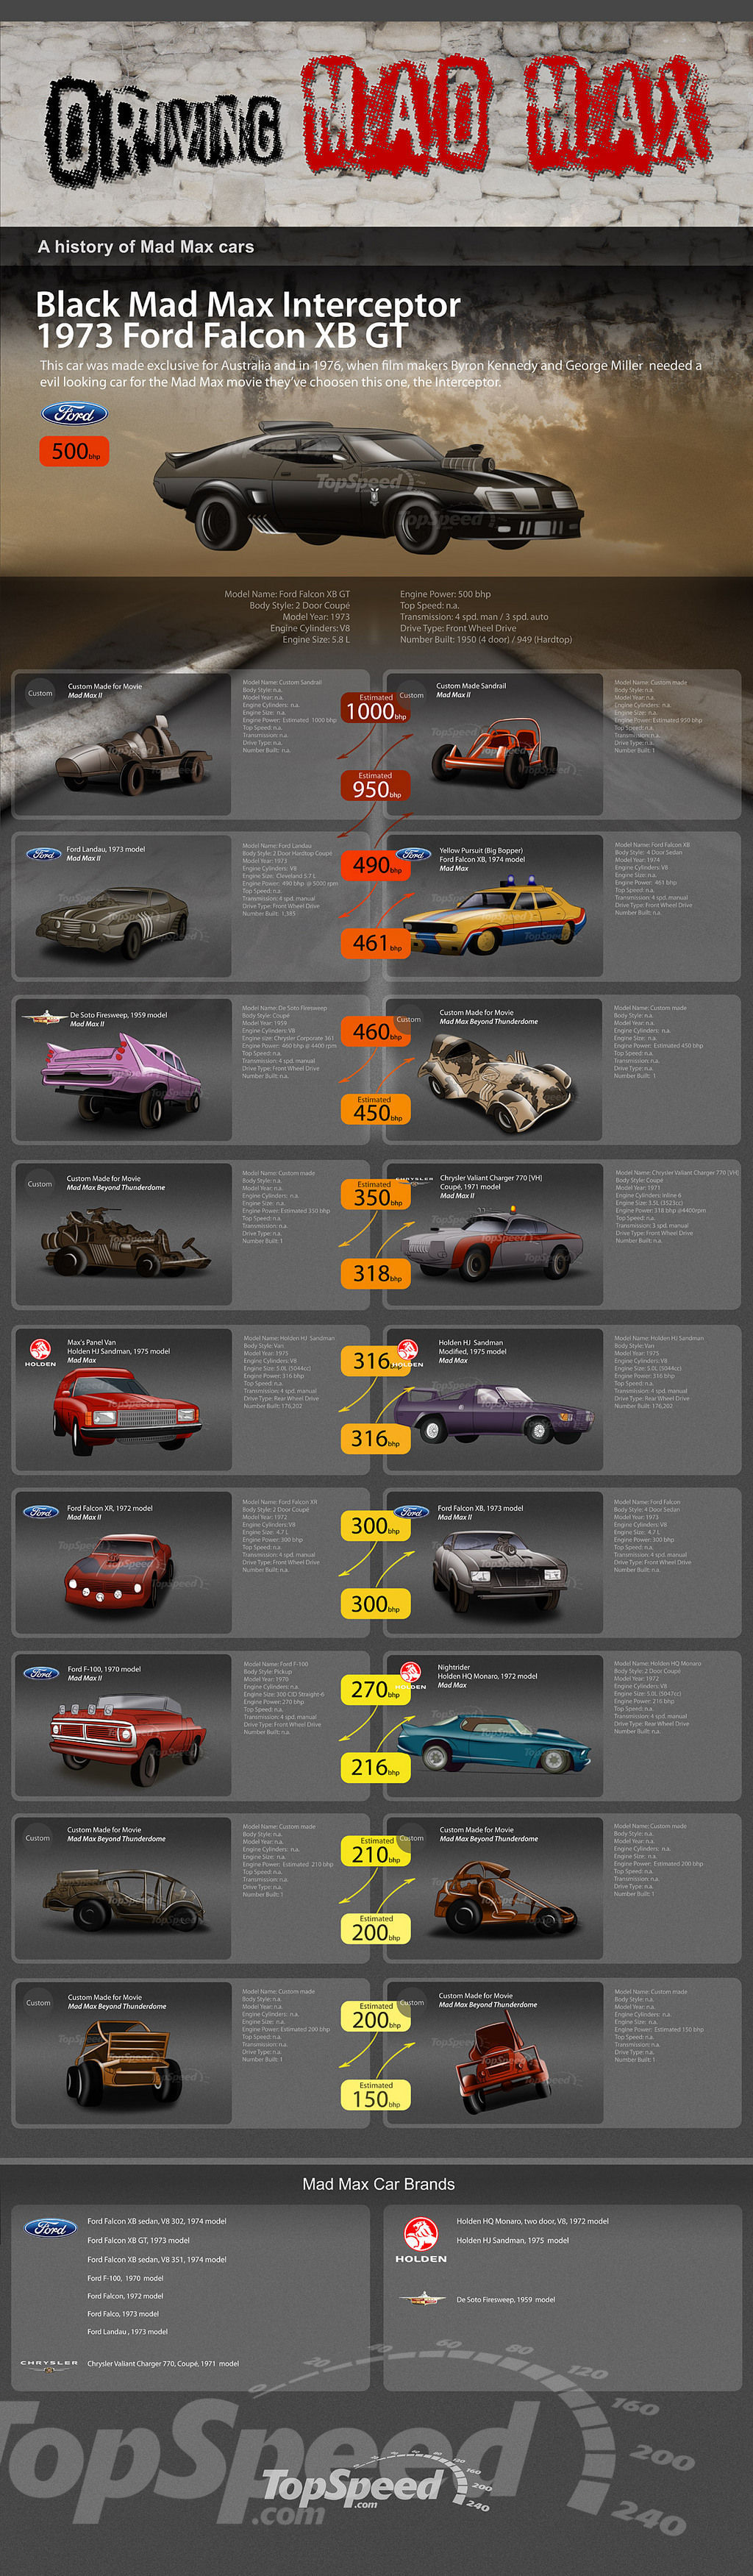
Driving mad max
The black mad max interceptor 1973 Ford Falcon XB GT was made exclusively for Australia in the year 1976. Some other Mad Max car models include Ford Landau 1973 model, Yellow Pursuit 1974 model, De Soto firesweep 1959 model and Nightrider 1972 model.
Source
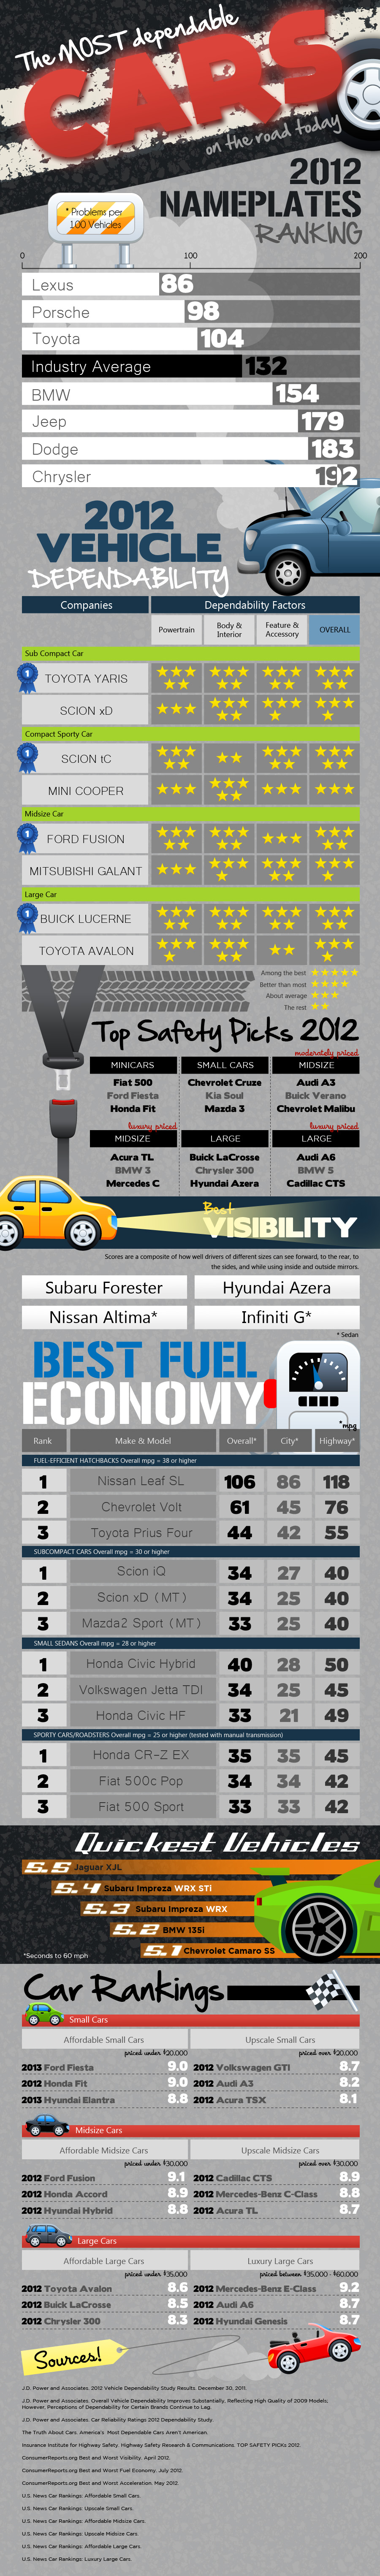
The most dependable cars on the road today
In the category of sub compact cars, Toyota Yaris and Scion XD are the most dependable cars whereas in the category of compact sporty cars, Scion tC and Mini cooper are the most dependable. Similarly, Ford Fusion and Mitsubishi Galant are dependable cars in midsize category whereas Buick Lucerne and Toyota Avalon are the most dependable cars in the large size car category.
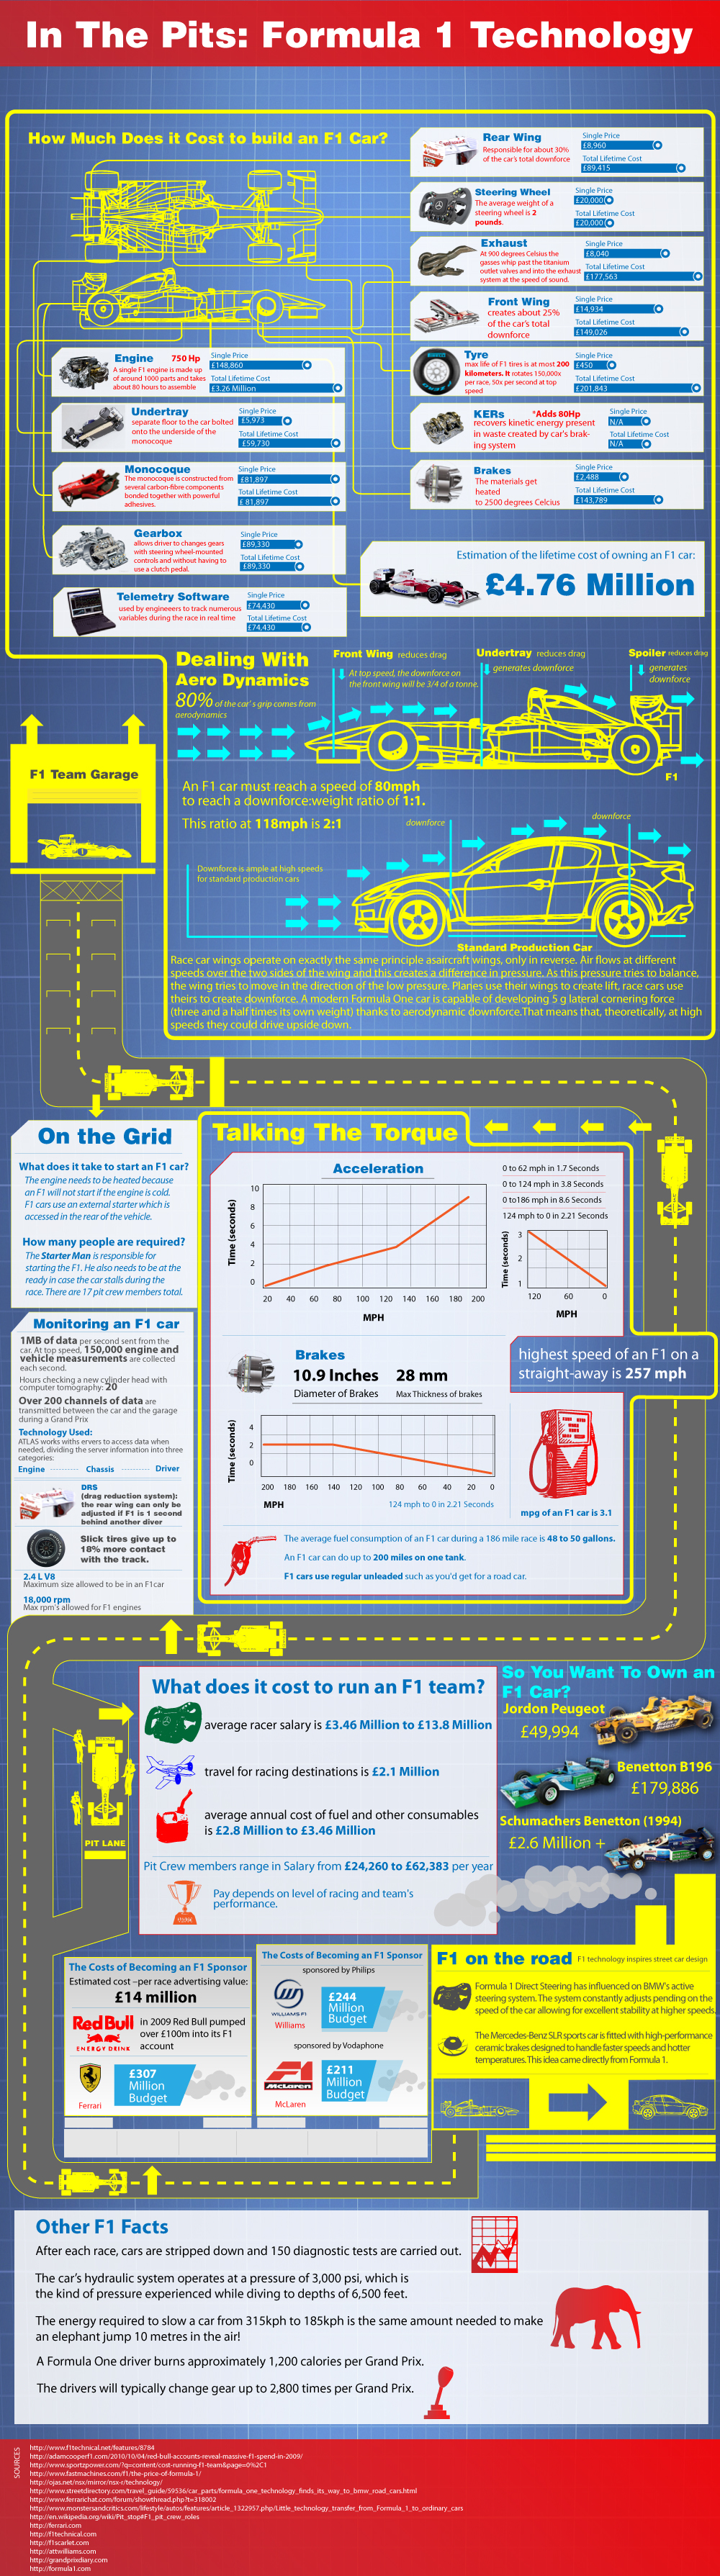
Formula 1 technology
The total lifetime cost of a rear wing of an F1 car is about 89415 pounds whereas the cost of engine for a lifetime is 3.26 million. The estimation of the lifetime cost of owning an F1 car is somewhere around 4.76 million pounds.
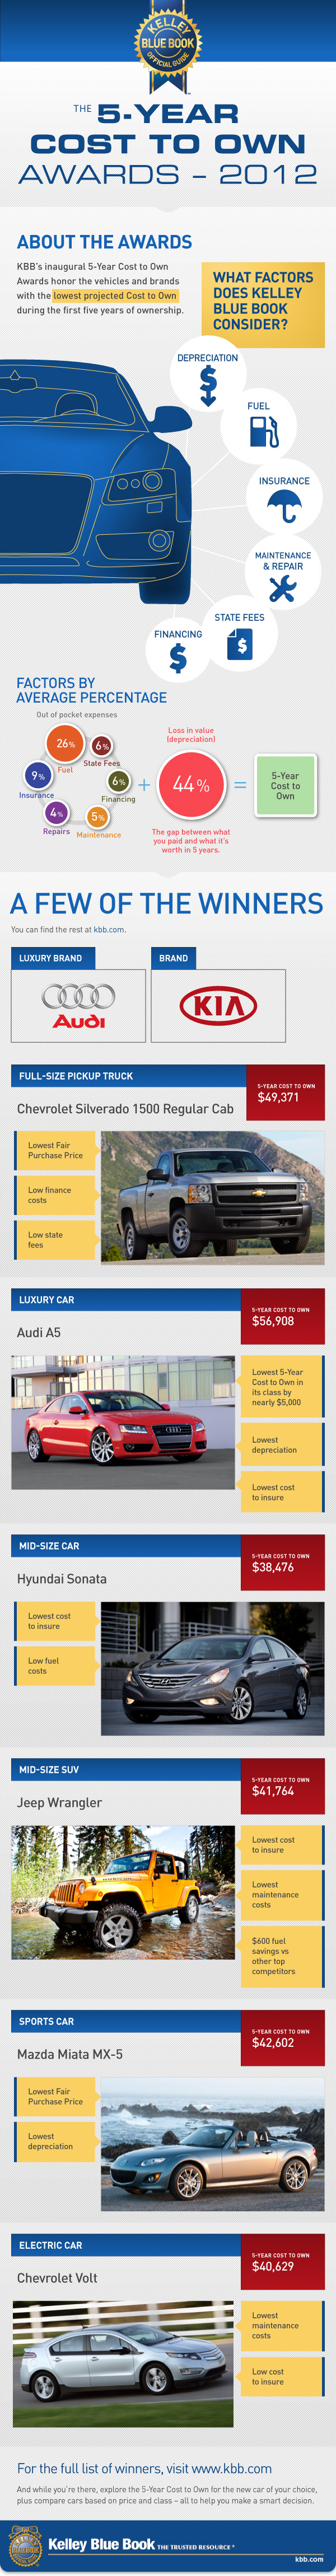
The 5 year cost to own awards 2012
The Kelley Blue book award for the best luxury brand 2012 was given to Audi whereas the award for the best brand was given to Kia. The best mid size car award went to Hyundai Sonata while that for the best mid size SUV went to Jeep Wrangler.
Source
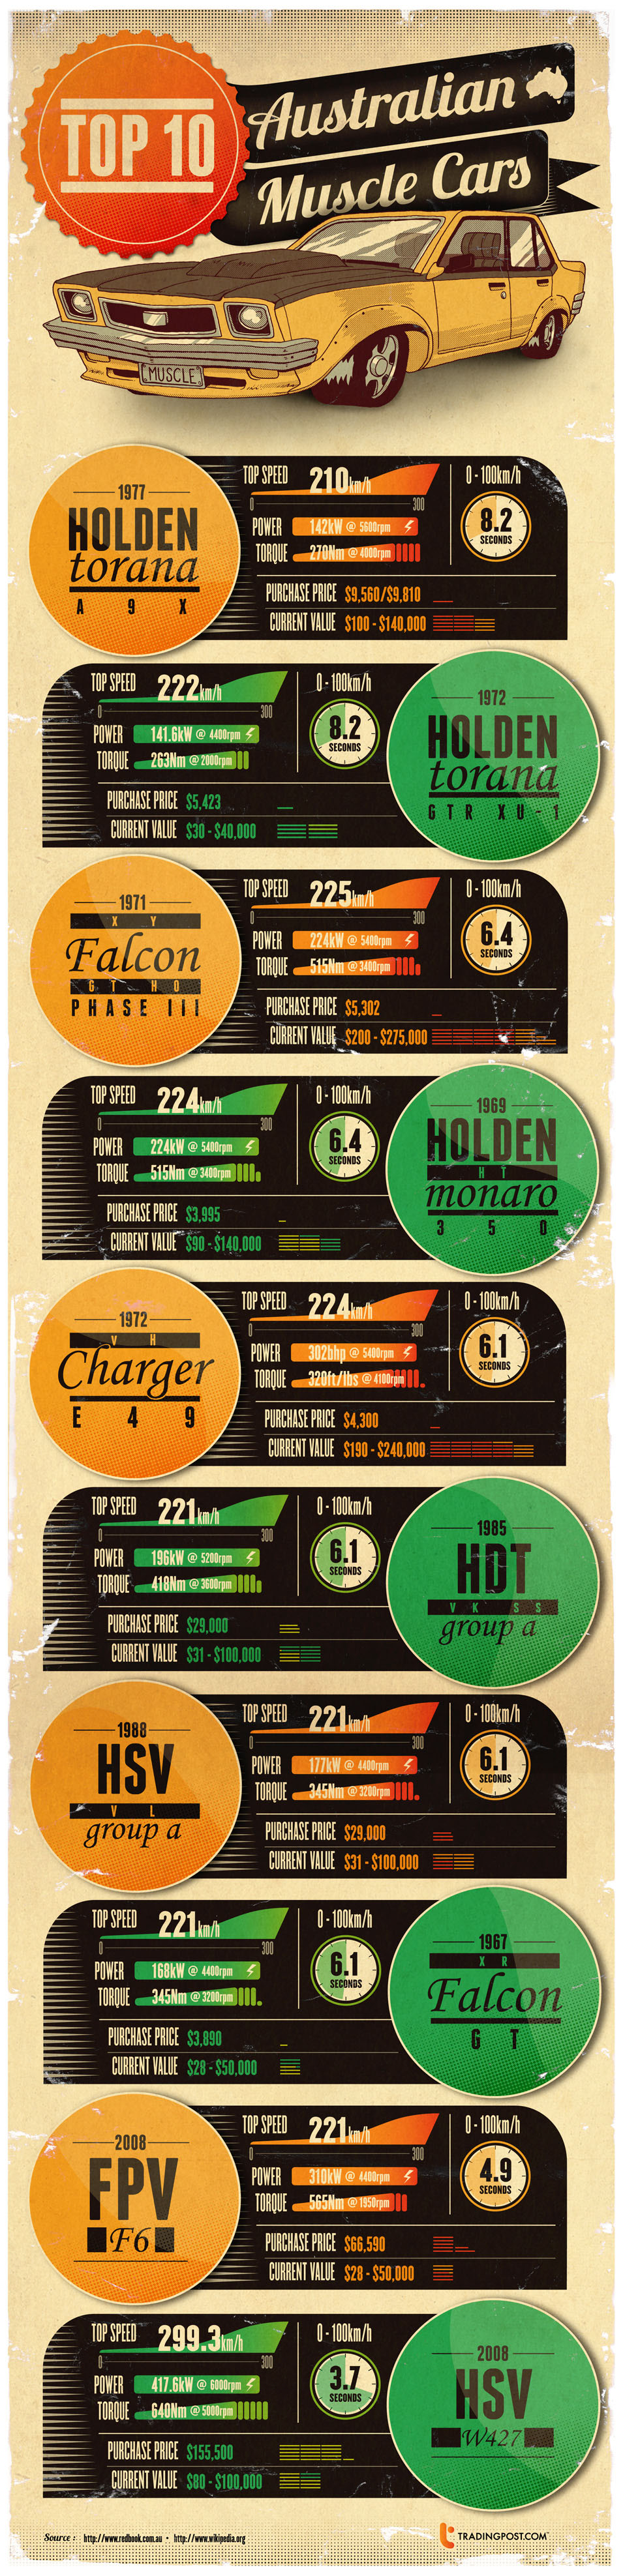
Top 10 Australian muscle cars
The top 10 Australian muscle cars are Holden Torana A9X, Holden Torana GTR XU-1, Falcon GT HO Phase III, Holden HT Monaro 350, Charger E49, HDT VK SS, HSV VL, XR Falcon GT, FPV F6 and HSV W427.
Source
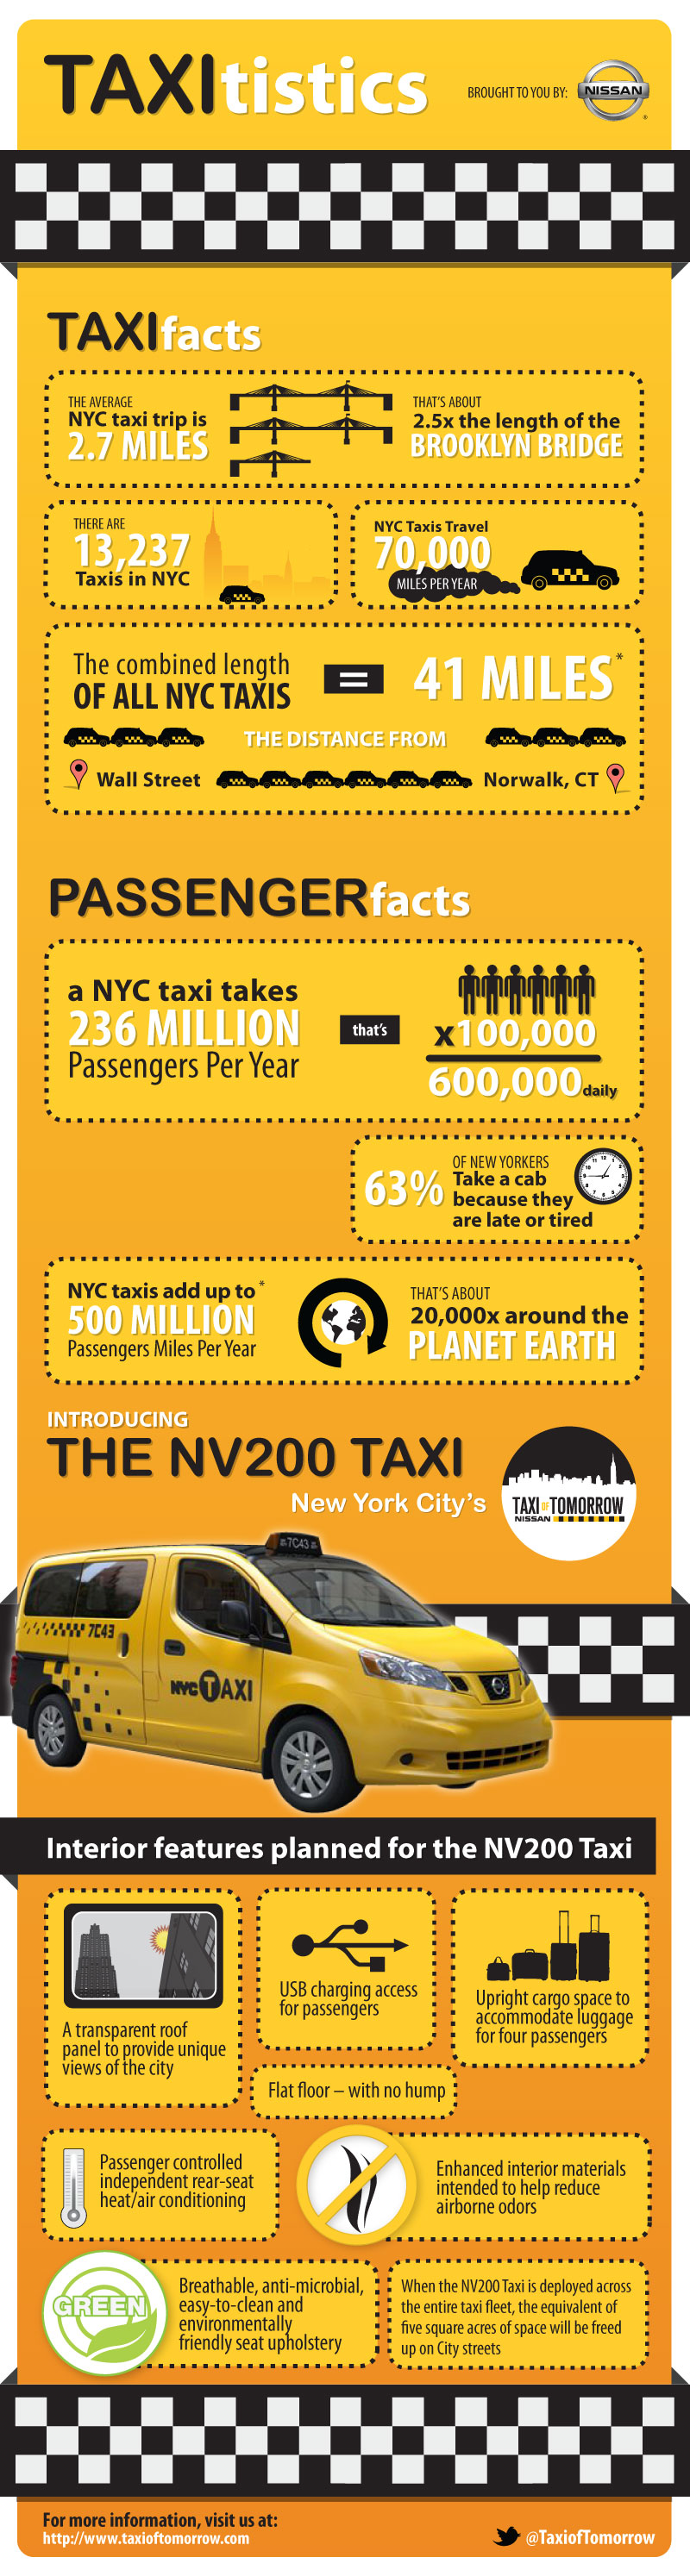
Taxi statistics
The average New York City taxi trip is 2.7 miles. There are about 13237 taxis in NYC alone and these taxis travel 70000 per year. An average NYC Taxi takes 236 million passengers per year. It is also a fact that 63% of the New Yorkers take a cab because they are tired or late.
Source
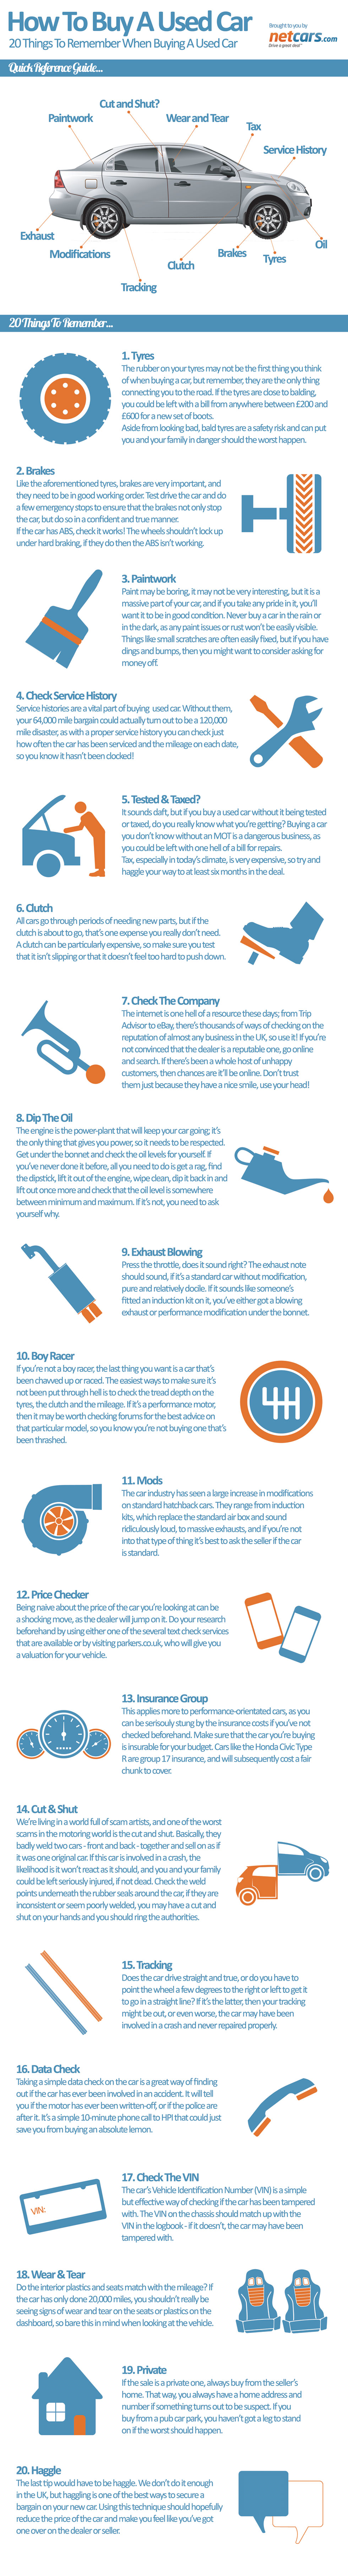
How to buy a used car
Some things to consider and check before buying a used car are:
- Tires
- Brakes
- Check service history
- Paintwork
- Clutch
- Exhaust blowing
- Boy racer
- Mods
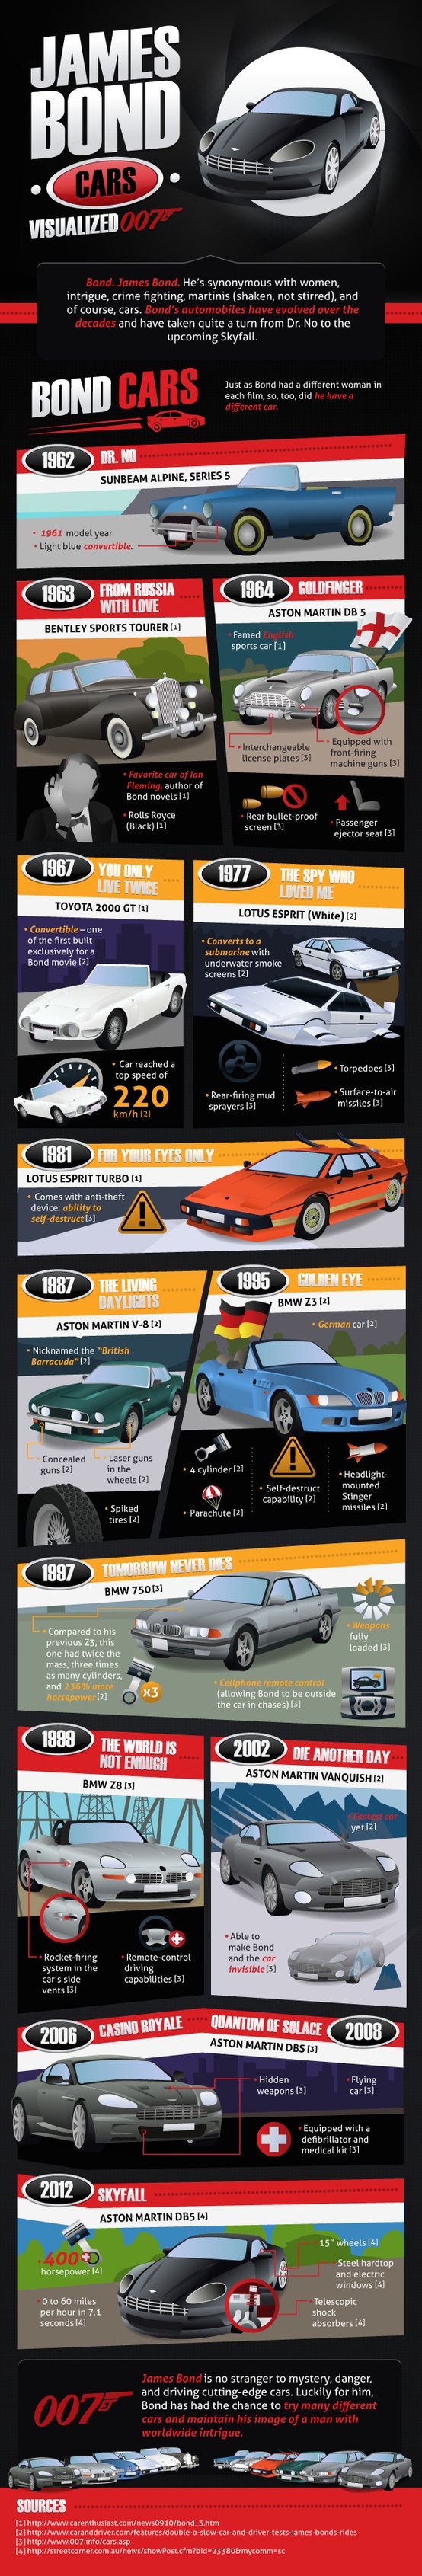
James Bond cars
In the year 1962, James Bond used Sunbeam Alpine Series 5 car in the movie Dr. No. Later in the movie Goldfinger, Bond used an Aston Martin DB 5. Some other cars used in James Bond movies are Toyota 2000 GT, Lotus Esprit, BMW Z3 and BMW 750.
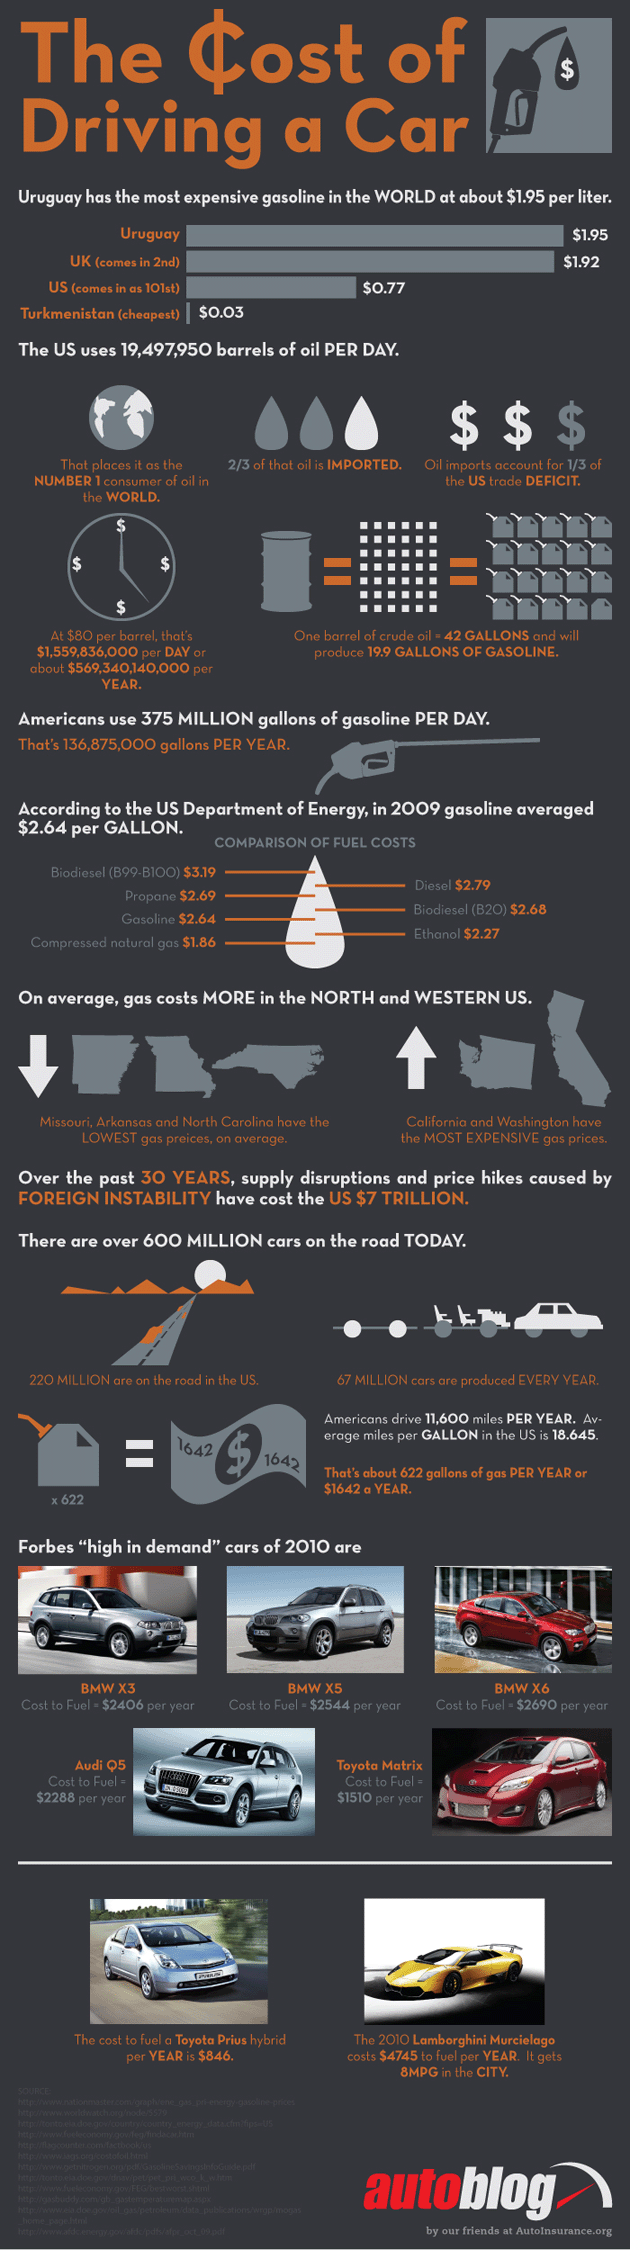
The cost of driving a car
Uruguay has the world’s most expensive gasoline followed by UK. Turkmenistan has the cheapest gasoline in the world. The US alone uses 19497950 barrels of oil per day whereas Americans use 375 million gallons of gasoline per day.