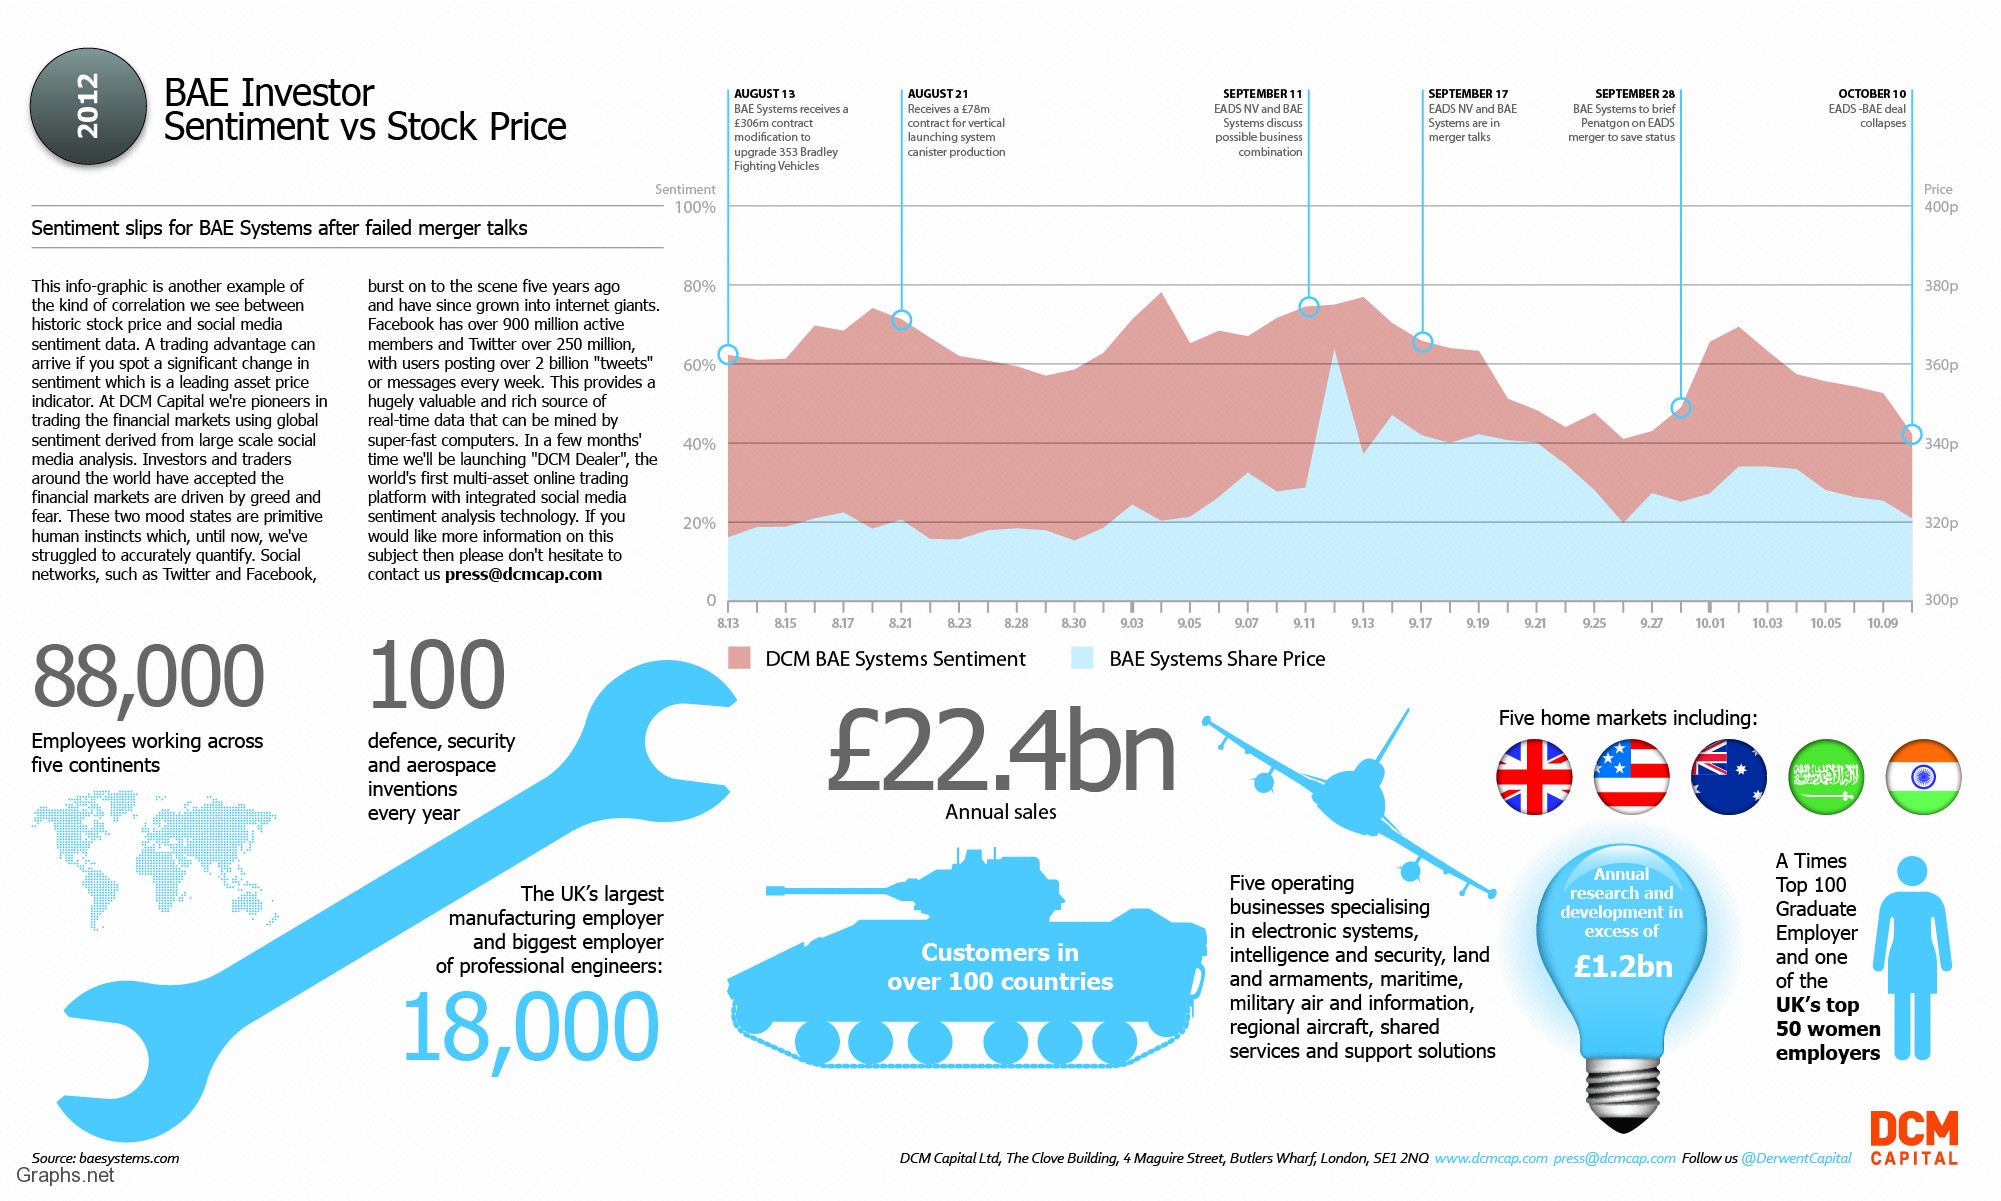
Everyone can get a little bit edgy when placing bets on something, when money is at stake any kind of reassurance about what you’re doing is a good thing. When it comes to spread betting it is no different. The only thing is it’s a little hard to predict what is going on within the spread betting world, however with sentiment analysis you can have an insight into what may happen before it does. One of the leading financial sector companies in the UK, Derwent Capital Markets have created a stunning infographic showing how sentiment actually correlates with real world historic figures, the infographic displays the correlation between historic stock data and the sentiment analysis of social networks. Proving the correlation between the two gives a good indication for people who wish to take part in spread betting, this gives more confidence to the spread betters about certain decisions that they make.