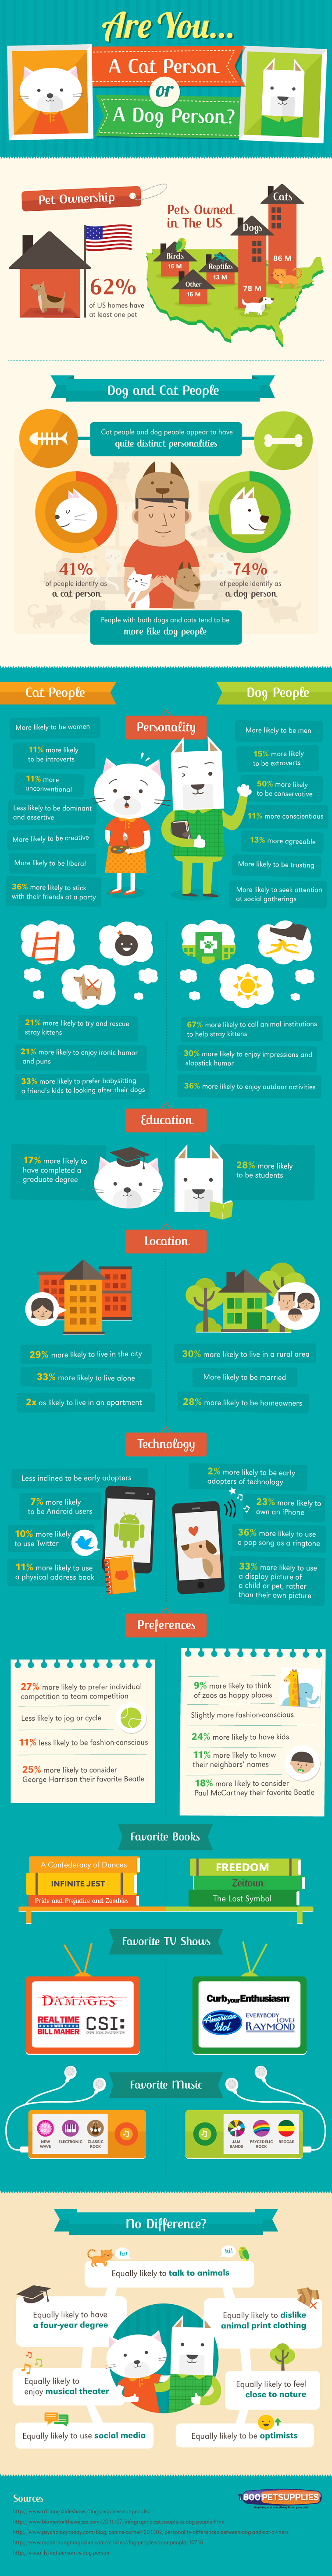
Some of us love cats and some of us love dogs. Most of us feel that it is our own way in which we decide or like what kind of pet we would like to prefer.
62% of US homes at least have 1 pet. Dogs account for 78 million, Cats 86 million, Reptiles 13 million, Birds 6 million and others 16 million.
On preference of pet’s owners can be classified into two kinds’ cat people and dog people. Dog people are more likely to be men, extroverts, conservative, conscientious, agreeable and trusting. They tend to seek a lot of attention in social gatherings.
Cat people are more likely to be women, introverts, un conventional, dominant, creative, liberal and more likely to stick with their friends at party.