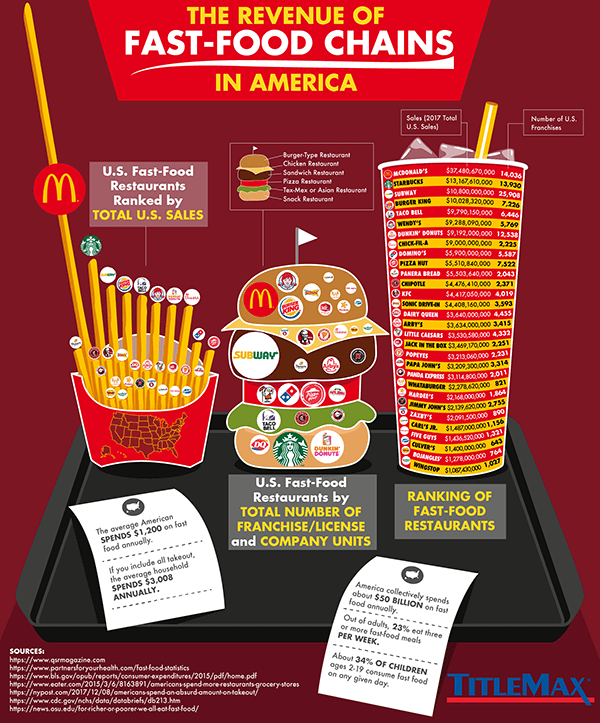
With society putting more of a focus on eating healthy, you would expect to see fast-food sales begin to slump. If this infographic from titlemax.com is proof, then the fast-food industry is alive and well. It ranks the top 30 fast-food chains by their annual revenue just within the United States and also includes the number of franchises under each company.
Some of these numbers may surprise you. For instance, ranked third on the list Subway has almost 26,000 franchises across the country, nearly double the amount of McDonald's', yet their total sales were less than a third of the amount that McDonald’s made. Burger King comes in at a close fourth but with only a quarter of the number of franchises as Subway.
This proves that more shop fronts do not always equal more sales! Americans spend an average of $1,200 on fast food every year, that’s $23 dollars on fast food every week! How does your own consumption of fast food compare to that of the average American?