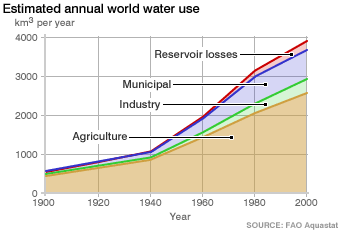
Water has a prominent role to play in agriculture to yield crops and in industries to manufacture various products. Water is usually supplied to people through pipe lines to meet their daily needs. It is used by every individual living on the planet and it is recorded that 500 cubic kilometers of water was utilized for agriculture in 1990 and by the year 2000, it has reached to 2,500 cubic kilometers.
More than 600 cubic kilometers of water was used by several industries in 1990 and the usage amount of water has been raised to 3,000 cubic kilometers by end of 2000. more than 3,500 cubic kilometers of water was utilized by municipal authorities in year 2000 and 4,000 cubic kilometers of water is utilized for reservoir losses.
