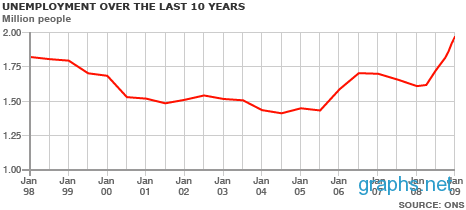
Unemployment of the UK in the past ten years from 1998 to 2009 has undergone rise and fall. The increase in the claimant count was the seventh in a row and was the biggest yearly rise since December 1992 - during the UK's last economic recession.
During Jan 1998, there were around 1.75 billion jobless people. But in the following years, the rate of unemployment decreased, especially during 1995-1996. However, in the year 2009, there were around 2 billion unwaged people.
It is clear that employers' demand for labour has weakened in the face of the economic slowdown and the likelihood was that unemployment will rise further in the months ahead. Falling employment and vacancies seems to have pointed to further increases in unemployment over the coming months.
