Gun laws have divided the masses for decades. Debates have always seemed to grow after periods of gun violence. Even as early as 1929, Prohibition drove gun violence and the Saint Valentine's Day Massacre saw seven gang members murdered in Chicago's Lincoln Park garage. This led to the first attempt to regulate firearms by Congress. Since then there have been more debates over gun regulations and bans of certain types of rifles. The majority of gun laws are enacted at the state level which means gun laws can and do vary across the map.
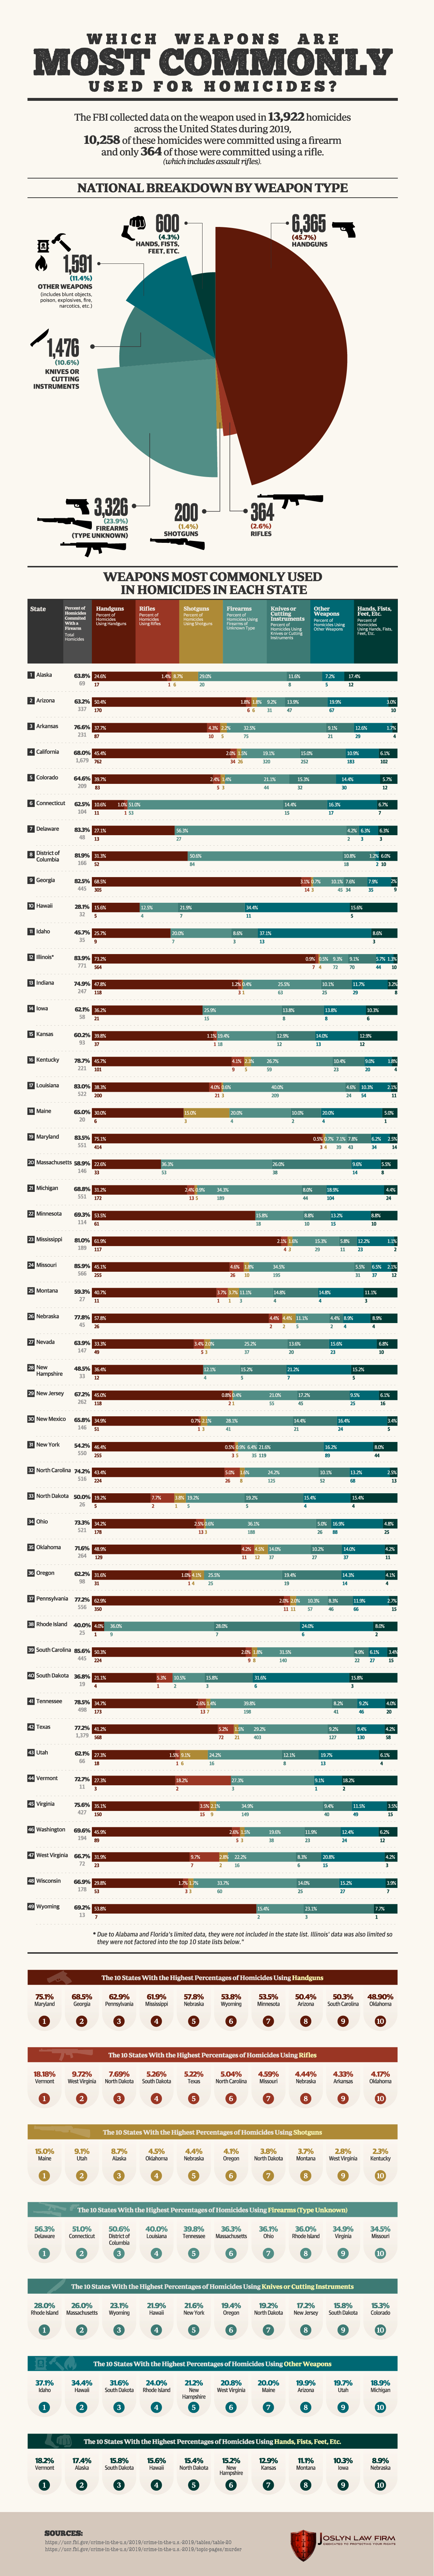
Do stricter gun laws lead to less gun violence? Or will people just use a different weapon if they can't get access to a gun? This pie graph and accompanying bar charts from the team at Joslyn Law Firm show the percentages of weapons most commonly used for homicides. The bar charts are set up for each state and display the percentages of homicides with each category of weapon; handguns, rifles, shotguns, non-firearms, body parts (hands, feet, fists), and unknown. Looking over the data you can see which weapons are clearly responsible for the most homicides.