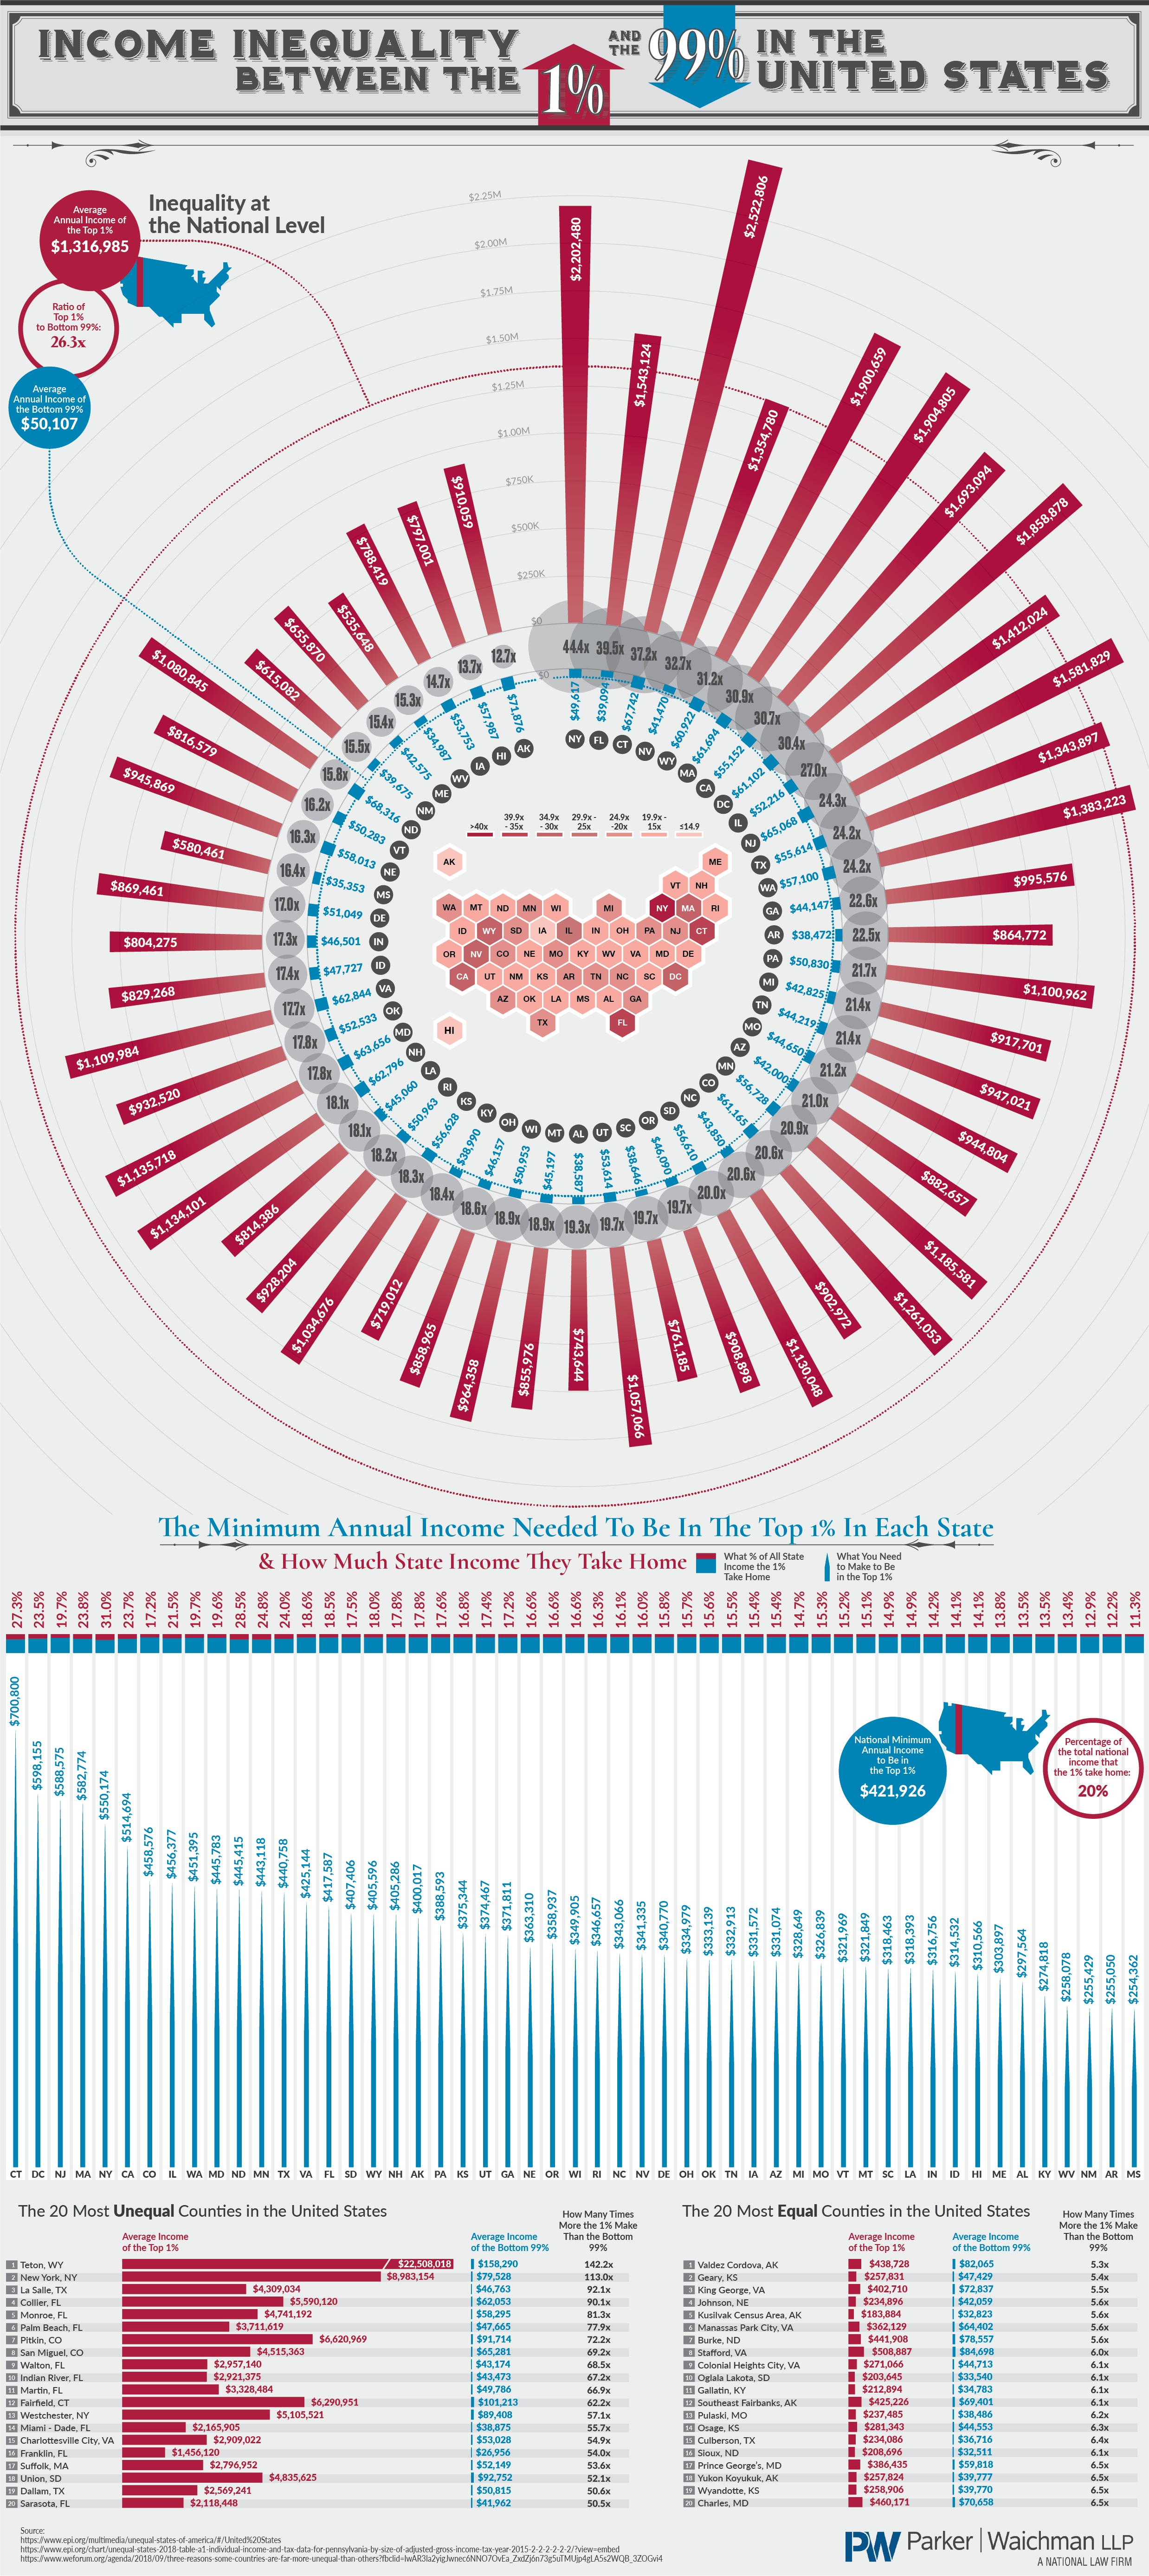
Income disparity is a significant issue in the United States and is often at the forefront of politics, social issues, and economic concerns. In fact, it is believed that America has more income inequality than any other developed nation. This infographic uses data from the Economic Policy Institute to visualize where income disparity is most prominent on a state-by-state basis. According to the data, the New York state has the widest gap between the average annual income of the top one percent ($2,202,480) and the bottom ninety-nine percent ($49,617).
That means that the top one percent makes 44.4 times the amount as the bottom ninety-nine percent. Just below New York is Florida. In Florida, the top one percent makes 39.5 times the amount as the bottom ninety-nine percent. In third place is Connecticut with the top one percent making 37.2 times the amount as the bottom ninety-nine percent. Being aware of where the greatest gaps exist is important for helping to solve the issue.