The one question that haunts us humans throughout our lives is ‘How long am I going to live?’
Life span is the average expected years for which a person or animal lives or a thing functions. Life expectancy is calculated using a mathematical tool called 'life table' that are constructed by taking death rates from the population in question and applying them to a hypothetical cohort of persons.
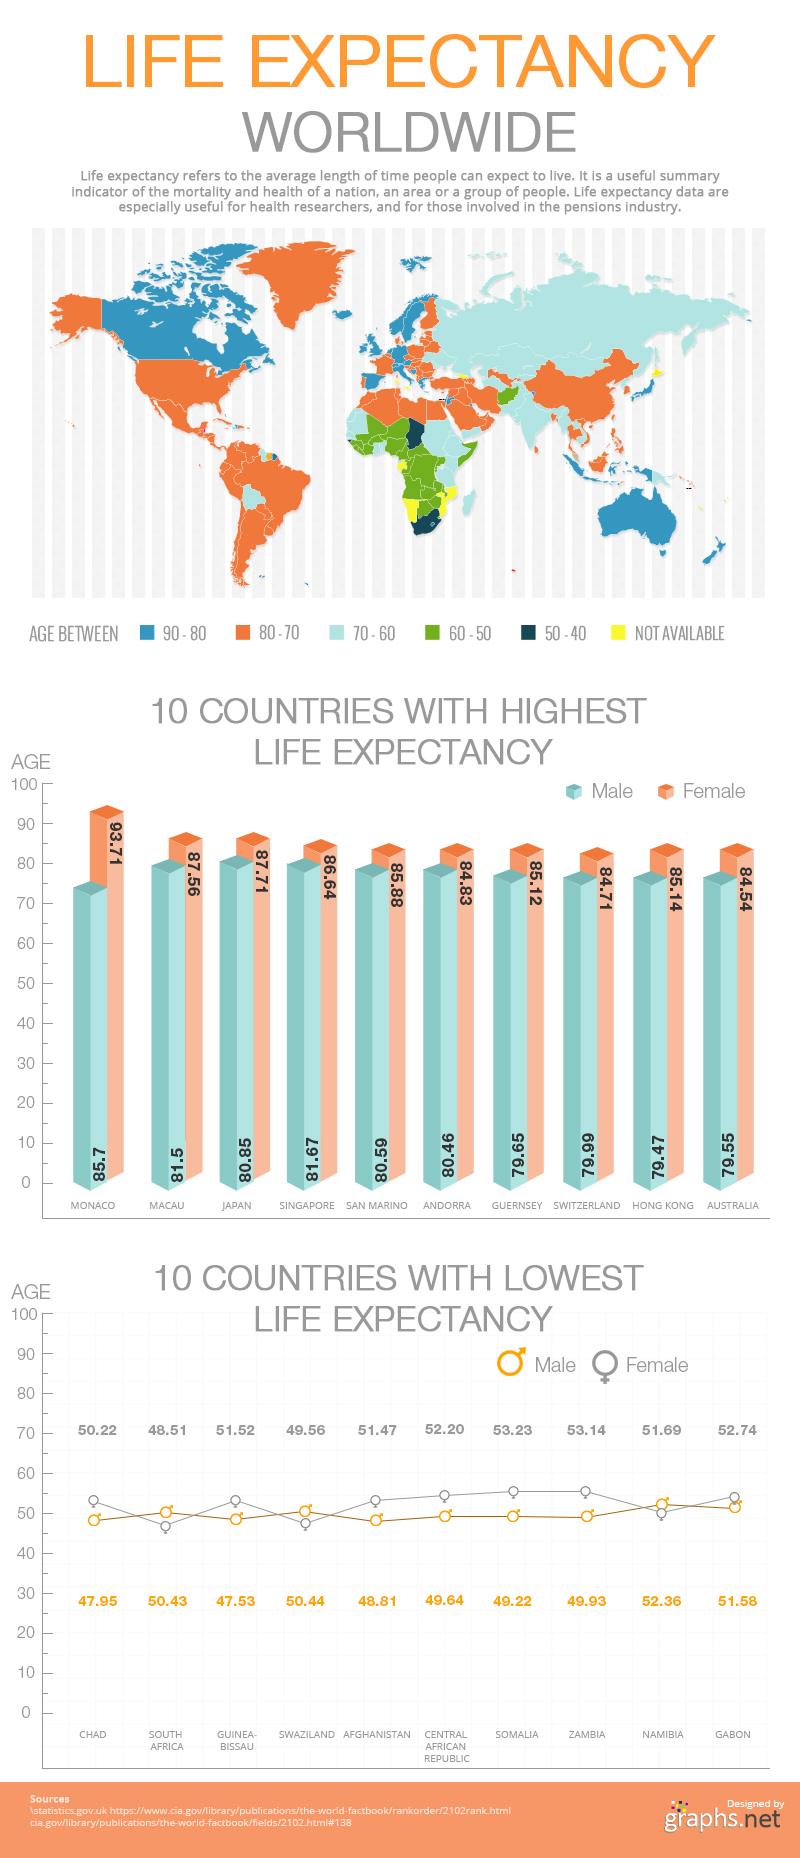
The oldest confirmed recorded age for any human being ever born till date has been 122 and we find that Monaco has a life expectancy of 89.63 years. But there exists a great variation between life expectancy statistics worldwide mostly because of differences in public health, medical care and diet that varies from country to country. Climate also has an effect on the years in our lives and of course, the way data is collected can also be an important influence.
Today, with the average life span of humans are looking much better than it did a few years previously though there still are countries that have an average life span on 49.09 years(Republic of Chad).