There’s no shortcut to creating popular and successful Facebook video content. After all, with more and more people viewing videos on Facebook, we see new pages rising to the surface with fresh video content every single day.
The social platform’s video potential is rising rapidly though and there’s never been a better time to start making video content with a Facebook audience in mind.
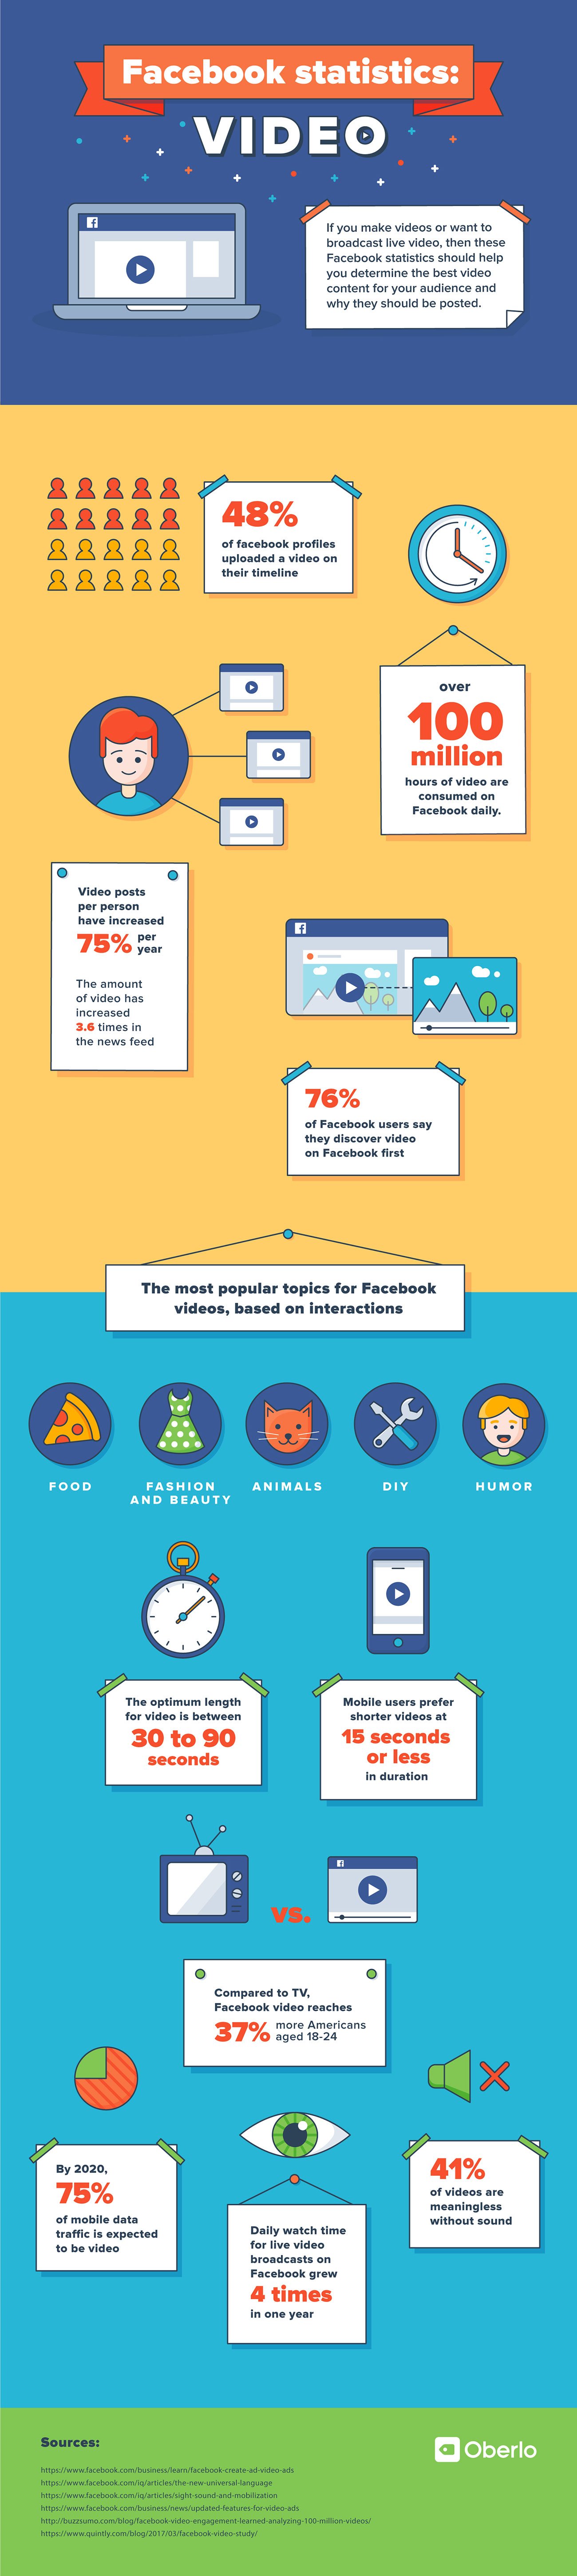
If you make social media videos and broadcast live video, or would like to start doing so, then these Facebook statistics will help you determine the best content for your audience and how it should be posted. How long should a video be? Sound or no sound? Why should I care about live video? All will be answered.
Oberlo has created a Facebook video guide with all the most important – and oftentimes surprising – statistics about the platform. Made for Shopify, Oberlo allows you to import products into your e-commerce store and dropship them to customers – and it’s super easy to use, too.
To learn more about Facebook insights and analytics, check out the 60 Facebook Statistics Marketers Need to Know.