Most business organizations and companies these days ask for the opinions of their customers through surveys. It is a way of staying connected with their customers and knowing about their likes and dislikes.
This helps the companies to review their products and services and suit them according to the requirements of their customers. Surveys are especially useful, when there is a huge competition in the market.
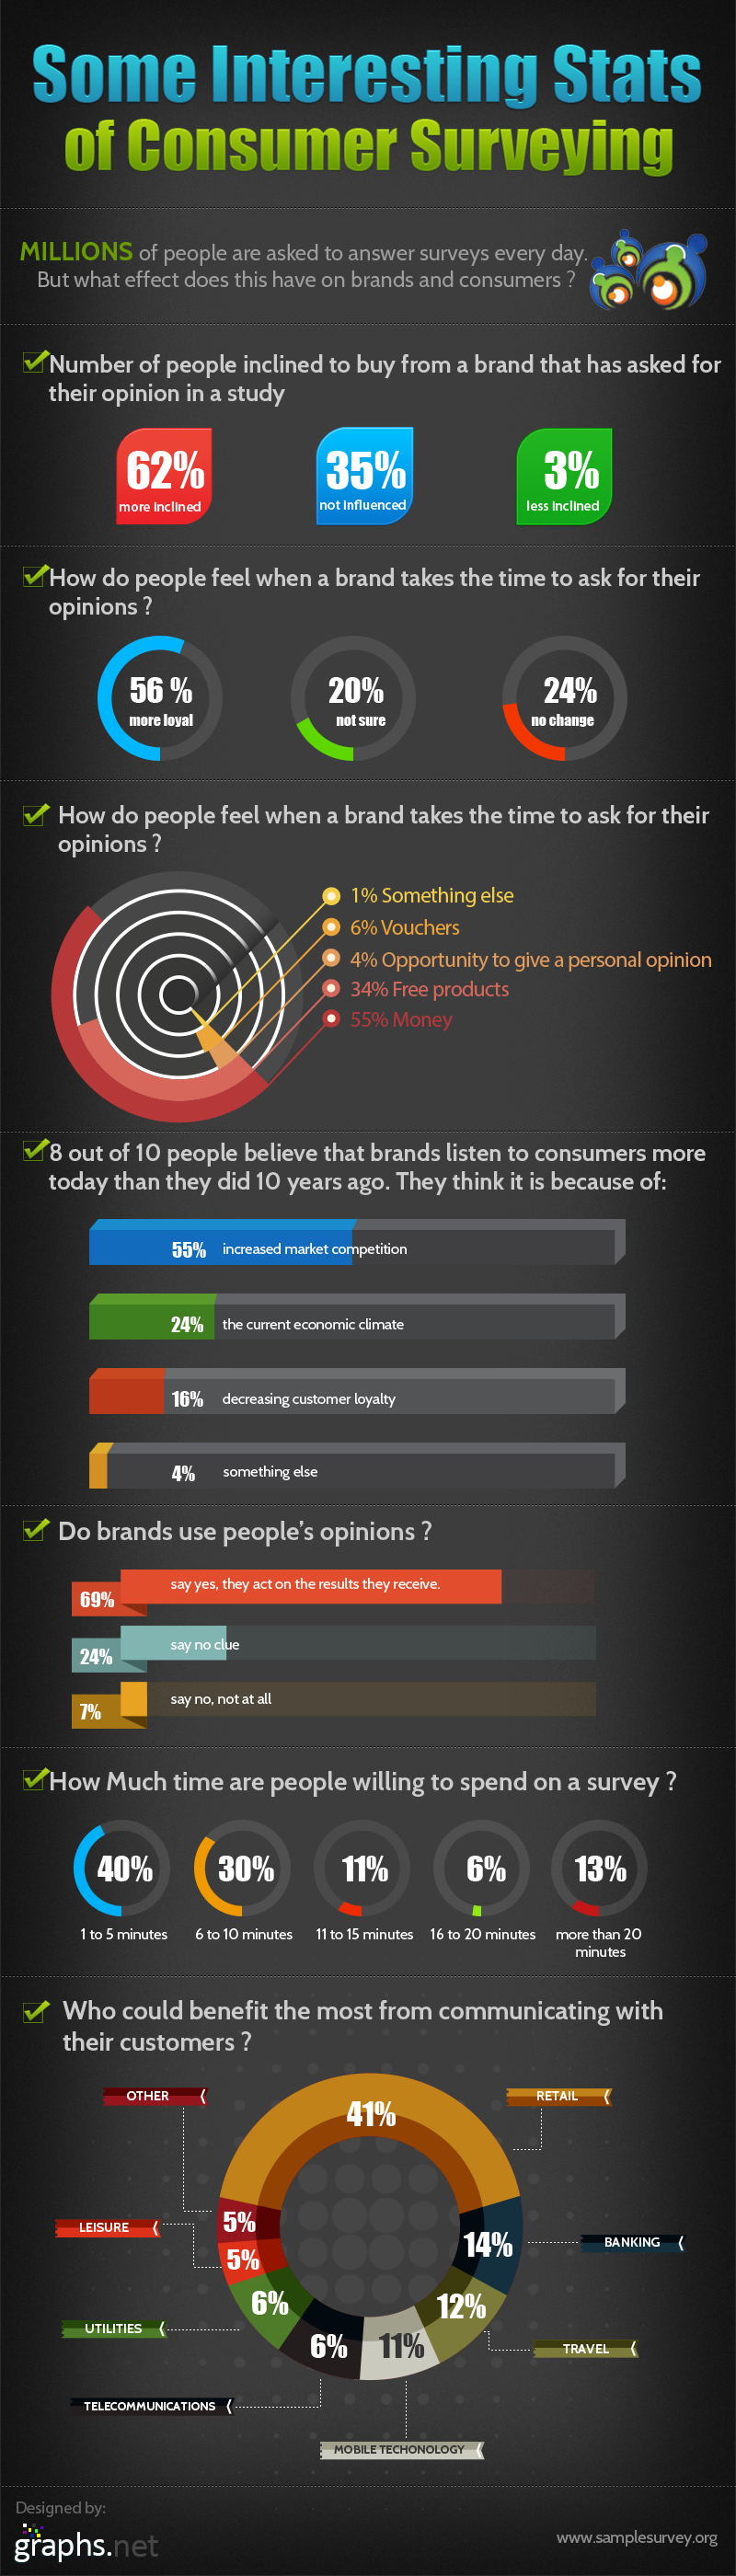
On being asked to take the survey, most costumers show interest and do it willingly, while some pay no heed. 56% of loyal customers willingly agree to take the survey of their favorite brands. As surveys require spending some time and giving thought before answering the questions, the companies usually offer free products or money in return.
Majority of individuals do it for the offers in return, while a small percentage see it as an opportunity to give their personal opinion. The companies make use of the results to find if the tastes and preferences of customers have changed or what they can do to meet the expectations.