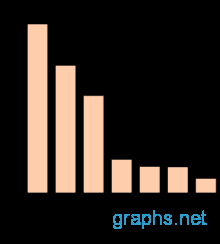
- Sample Bar Graph
A bar graph is a specific kind of graph which presents the information of the graph in the form of solid bars with varying heights corresponding to varying frequencies on the y-axis. The horizontal x-axis forms the base axis and contains the grouped data, while the y-axis contains the frequency to which the grouped data corresponds to.
In order to create a bar graph, a suitable title must be chosen which will immediately clarify an audience regarding what the bar graph is all about.
The x axis must be determined and the grouped data of the graph must be entered. The stable or fixed units of the graph are usually entered in the x axis. For example, if one is plotting the price of wool in terms of packets, the price per packet shall be plotted on the x axis.
The vertical or y axis must contain the inconstant values. Depending on the nature of the scale, points can be plotted at any interval, usually 5 units, 10 units or even 100 or 1000units.
The bars of the graph will indicate the various points plotted. They can be distinguished by color or pattern and care should be taken to make the bar graph such that the import of the graph is available at once.