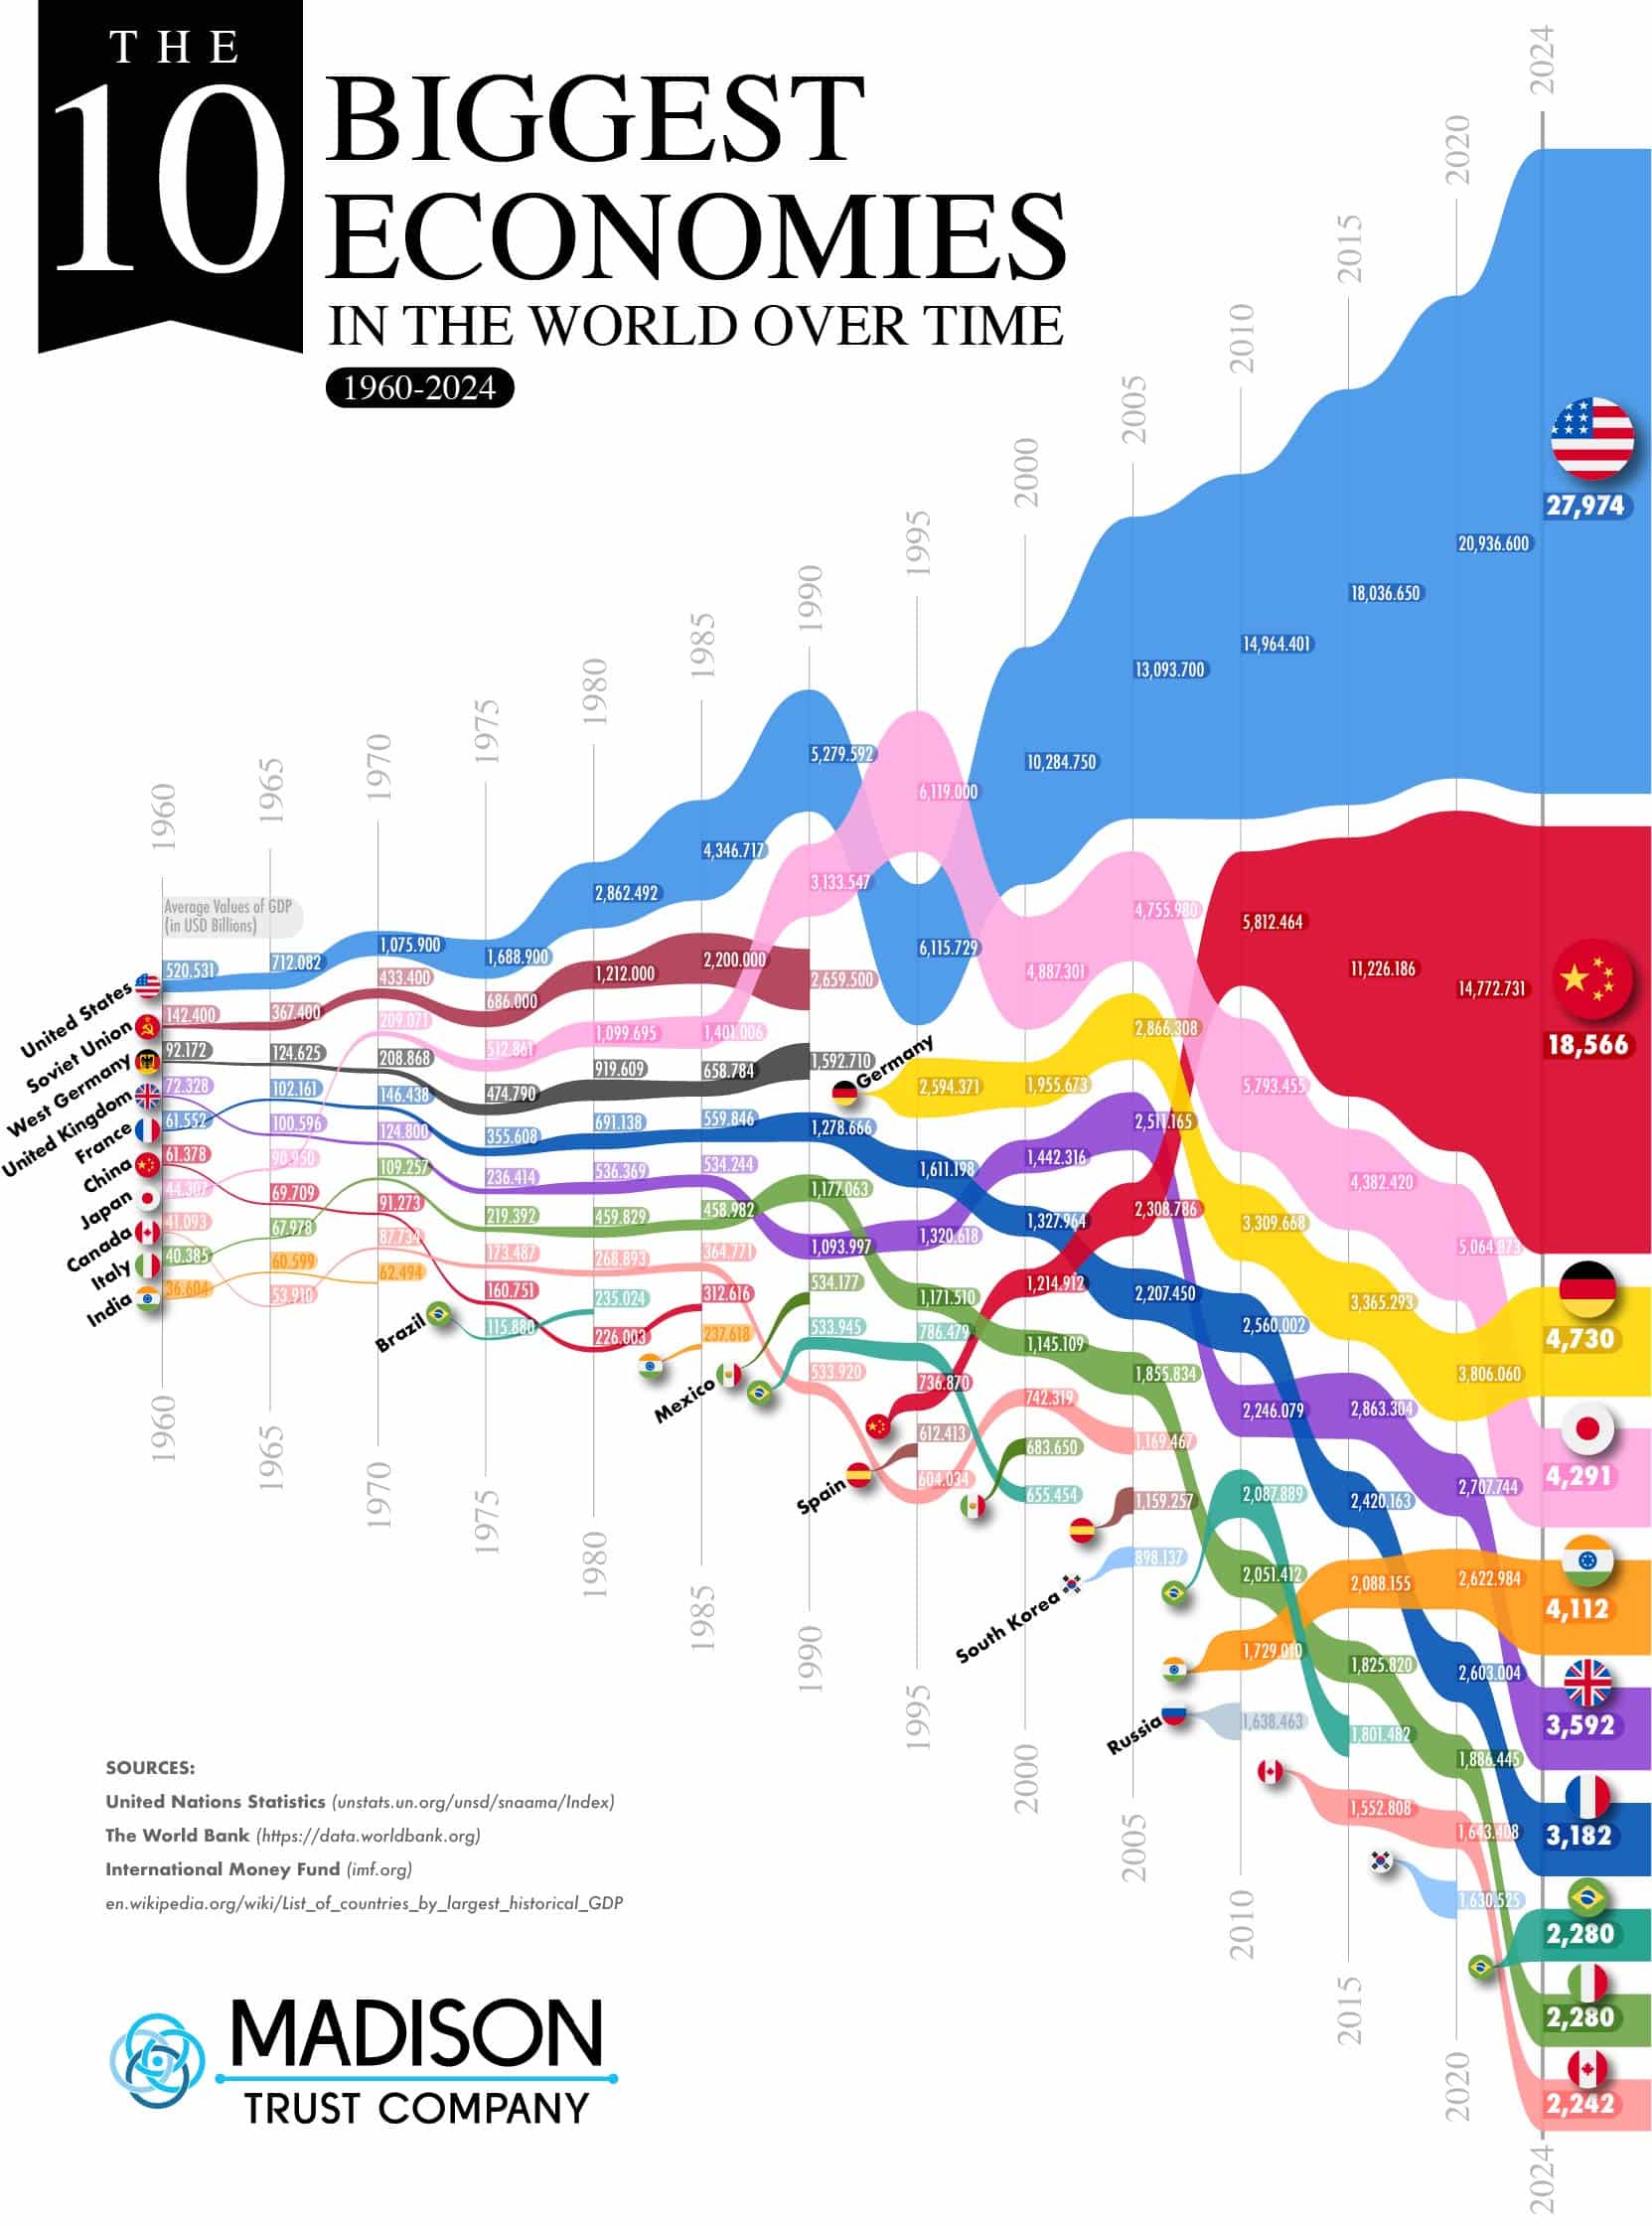
Timelines are a great way to visualize history. They can chart many changes over the decades or even centuries, but with this graphic, Madison Trust Company gave us a fascinating look at the changing times through world economies. They ranked countries from 1960 to 2024 by their GDP.
Through this graphic, we can see some major historical events and their impact on economies. For example, the Soviet Union was once the second biggest economy in the world, but a revolution dissolved the country in 1990. The Soviet Union dropped off the chart and became Russia, which only rose up to the top 10 level again in the 2000s before dropping again in 2010.
We can also see Japan’s rise in the 1990s after the Korean War. This was a huge period of economic growth for the nation as their workforce grew, and Japanese electronics became popular worldwide. They even surpassed longtime world leader, the United States, during this decade.